Molecular Vibration
Pipeline description
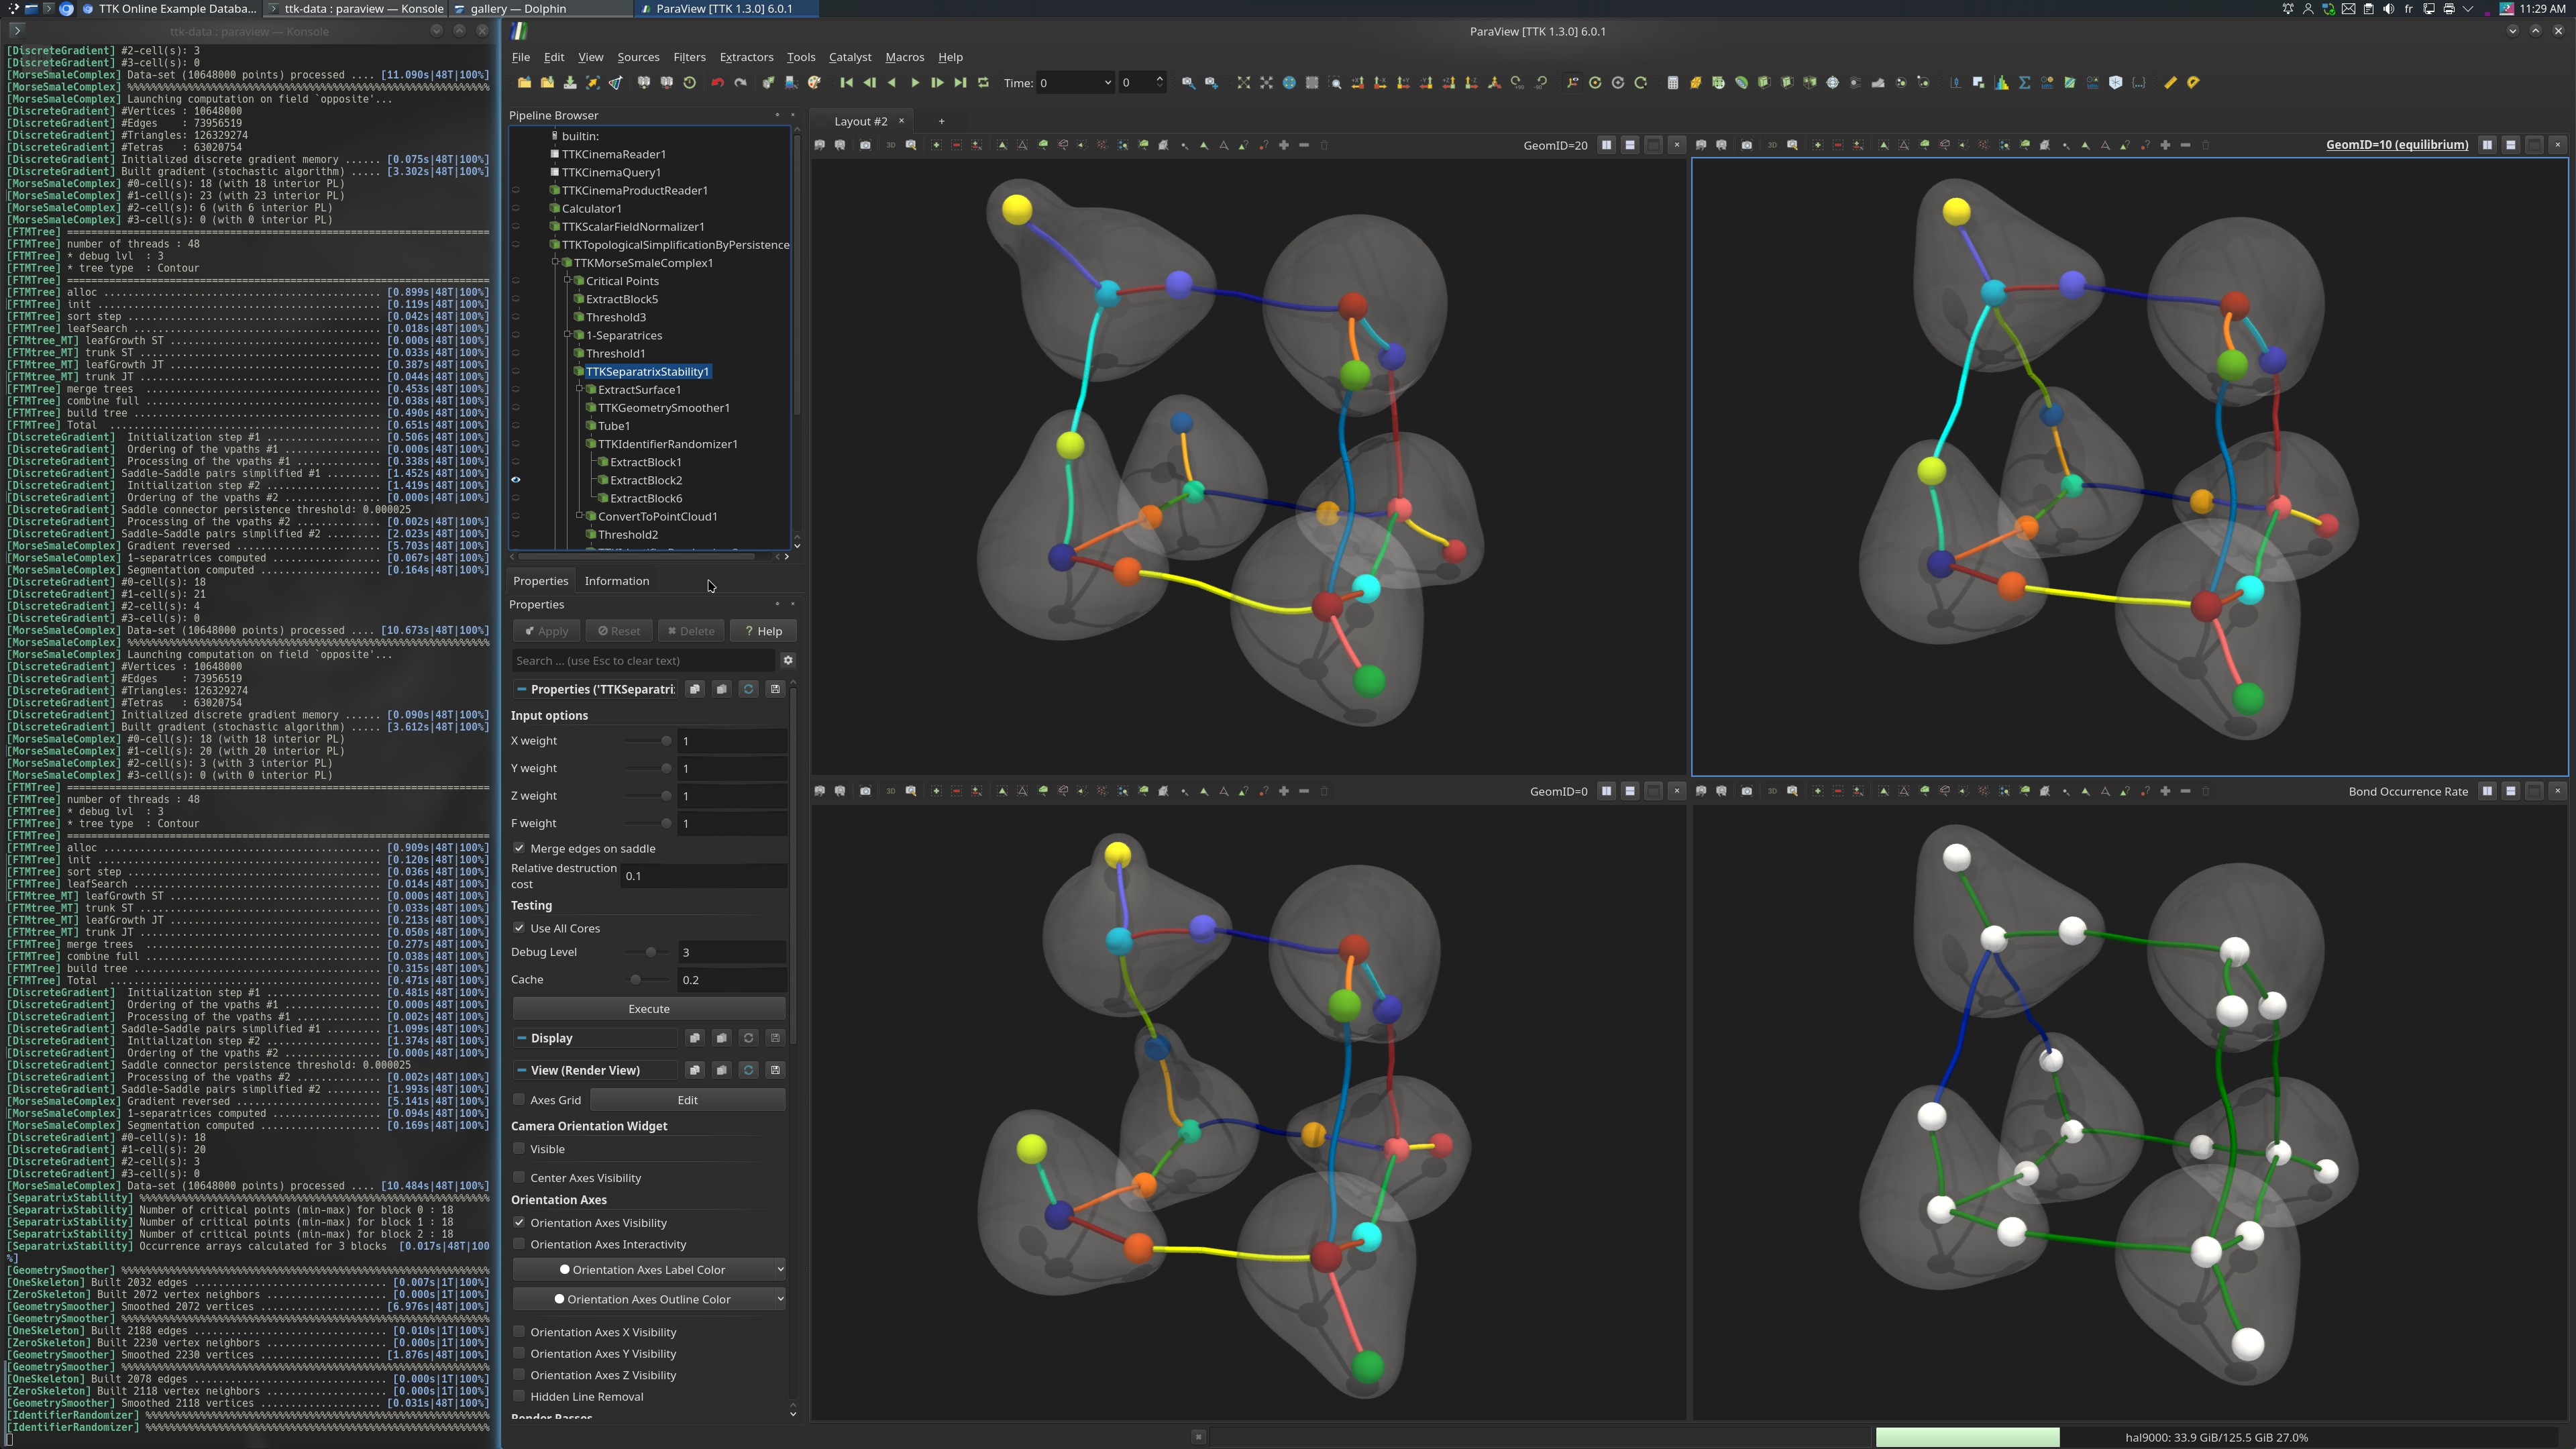
This example computes the Bond Occurrence Rate from an ensemble of electron density fields modeling a molecular system (the so-called Prism water hexamer) under molecular vibration. Specifically, this example partly reproduces the Figure 7 of the paper BondMatcher: H-Bond Stability Analysis in Molecular Systems.
The pipeline includes the following steps.
First, the appropriate datasets are read from disk using the filters CinemaReader, CinemaQuery, and CinemaProductReader. Specifically, the dataset GeomID=10 (top right) corresponds to the equilibrium state of the molecule, while the datasets GeomID=0 (bottom left) and GeomID=20 (top left) correspond to its most extreme vibrations.
Second, for convenience, the opposite of the density is considered and normalized with the ScalarFieldNormalizer to facilitate the subsequent processing steps.
Third, TopologicalSimplificationByPersistence is used to remove spurious extrema from the data, such that only 18 minima remains for each dataset (for the 18 atoms of the water hexamers).
Next, for each scalar field, the MorseSmaleComplex is computed. This complex is post-processed to cancel the least salient saddle-saddle pairs (see the checkbox Return Saddle Connectors).
At this stage, the 1-dimensional separatrices of the complex are filtered, to only keep the saddle-minimum separatrices. This yields an Extremum Graph, which includes the minima of the scalar field and which connects them according to the saddle-minimum separatrices (representing chemical interactions, e.g., an H-bond or a covalent bond).
Finally, the Bond Occurrence Rate is computed from this extremum graph with the filter SeparatrixStability and it is visualized for the equilibrium state (bottom right). For each chemical interactionn, this quantity documents the rate of its occurrence in the ensemble (see the publication BondMatcher: H-Bond Stability Analysis in Molecular Systems for the formalization of this measure). Specifically, each occurrence rate is saved as the CellDataArray named Occurrence, itself associated to the output extremum graphs.
ParaView
To reproduce the above screenshot, go to your ttk-data directory and enter the following command:
paraview states/molecularVibration.pvsm
Python code
1 2 3 4 5 6 7 8 9 10 11 12 13 14 15 16 17 18 19 20 21 22 23 24 25 26 27 28 29 30 31 32 33 34 35 36 37 38 39 40 41 42 43 44 45 46 47 48 49 50 51 52 53 54 | |
To run the above Python script, go to your ttk-data directory and enter the following command:
pvpython python/molecularVibration.py
Inputs
- molecularVibration.cdb: Prism hexamer under molecular vibration, one equilibrium state and 2 perturbed states.
Outputs
bondOccurenceRates.vtm: Extremum graph for the equilibrium state, with its occurrence rate defined on each 1-dimensional separatrix.