MPI Example
This toy example illustrates the usage of TTK in a distributed-memory context with MPI. For this example, the original data set is small. Thus, the pipeline first resamples it to 256^3 but this dimension can be changed to fit the capabilities of your distributed system.
For more information about how to run a pipeline in parallel in ParaView with MPI, please refer to the ParaView documentation.
Please note both ParaView and TTK need to be compiled with MPI to allow for parallel execution in a distributed context. For that we refer the reader to the ParaView and TTK installation instructions, but, in short, this can be done by setting the following CMake flags PARAVIEW_USE_MPI=ON and TTK_ENABLE_MPI=ON for ParaView and TTK respectively. Also, for processing large-scale datasets (typically beyond 1024^3), we recommend to build TTK with 64 bit identifiers (by setting the CMake flag TTK_ENABLE_64BIT_IDS=ON).
Pipeline description
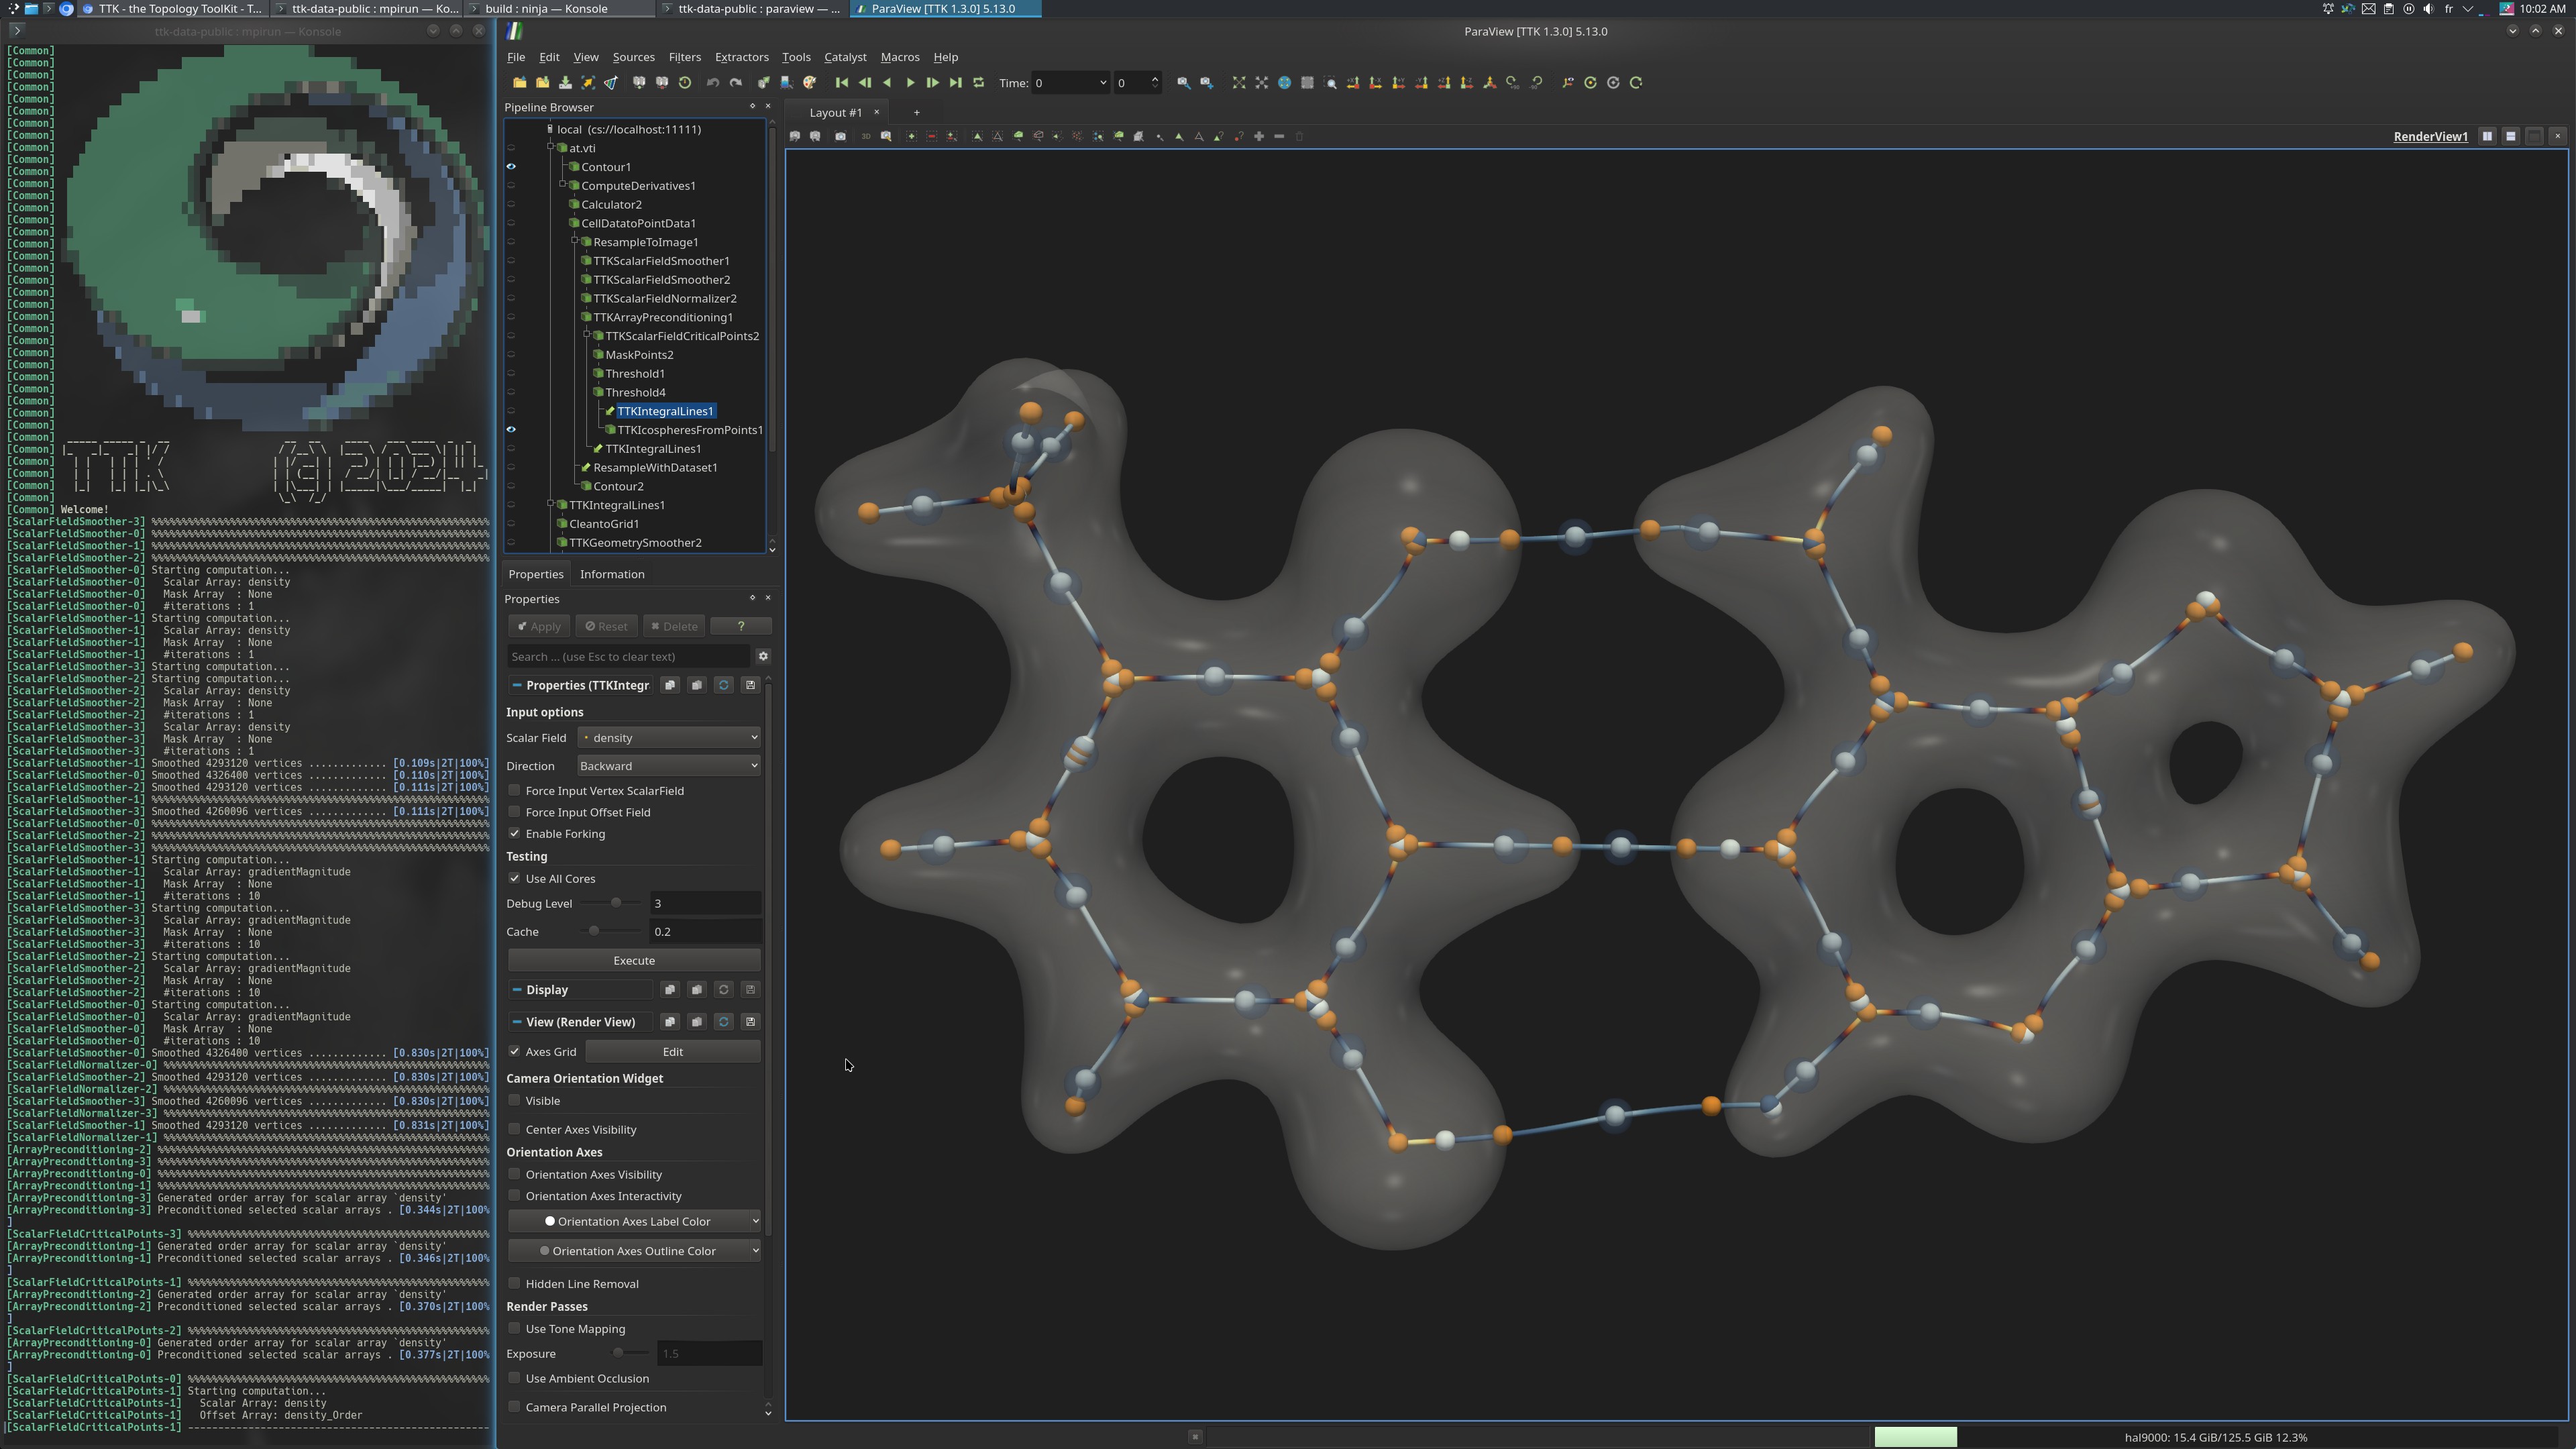
The produced visualization captures the covalent and hydrogen bonds within the Adenine-Thymine molecular complex. It also shows where the electronic density experiences rapid changes, indicating transition points occurring within the bond.
First, the magnitude of the scalar field is computed and the data set is resampled to 256^3. This dimension can be changed
(see the corresponding Python script below).
Then, both the scalar field and its magnitude are smoothed via ScalarFieldSmoother and normalized via ScalarFieldNormalizer.
Next, the critical points of the scalar field are computed via ScalarFieldCriticalPoints and used as seeds of the IntegralLines.
Next, the geometry of the integral lines is smoothed using the GeometrySmoother.
Finally, the critical points of the magnitude are computed on the smoothed geometry of the integral lines.
ParaView
To reproduce the above screenshot on 4 processes and 2 threads, go to your ttk-data directory and enter the following command:
OMP_NUM_THREADS=2 mpirun --bind-to none --map-by node -n 4 pvserver
states/mpiExample.pvsm in the ParaView GUI through File > Load State.
Python code
  1
  2
  3
  4
  5
  6
  7
  8
  9
 10
 11
 12
 13
 14
 15
 16
 17
 18
 19
 20
 21
 22
 23
 24
 25
 26
 27
 28
 29
 30
 31
 32
 33
 34
 35
 36
 37
 38
 39
 40
 41
 42
 43
 44
 45
 46
 47
 48
 49
 50
 51
 52
 53
 54
 55
 56
 57
 58
 59
 60
 61
 62
 63
 64
 65
 66
 67
 68
 69
 70
 71
 72
 73
 74
 75
 76
 77
 78
 79
 80
 81
 82
 83
 84
 85
 86
 87
 88
 89
 90
 91
 92
 93
 94
 95
 96
 97
 98
 99
100
101
102
103
104
105
106
107
108
109
110
111
112
113
114
115
116
117
118
119
120
121
122
123
124
125
126
127
128
129
130
131
132
133
134
135 | #!/usr/bin/env python
import sys
from paraview.simple import *
# ----------------------------------------------------------------
# Choose the resampling dimension for the example
# ----------------------------------------------------------------
if len(sys.argv) == 2:
dim = int(sys.argv[1])
else:
dim = 256
# create a new 'XML Image Data Reader'
atvti = XMLImageDataReader(FileName=["at.vti"])
atvti.PointArrayStatus = ["density"]
calculator1 = Calculator(Input=atvti)
calculator1.ResultArrayType = "Float"
calculator1.ResultArrayName = "density"
calculator1.Function = "density"
# create a new 'Compute Derivatives'
computeDerivatives1 = ComputeDerivatives(Input=calculator1)
computeDerivatives1.Scalars = ["POINTS", "density"]
computeDerivatives1.Vectors = ["POINTS", "1"]
# create a new 'Calculator'
calculator2 = Calculator(Input=computeDerivatives1)
calculator2.AttributeType = "Cell Data"
calculator2.ResultArrayName = "gradientMagnitude"
calculator2.Function = "mag(ScalarGradient)"
calculator2.ResultArrayType = "Float"
# create a new 'Cell Data to Point Data'
cellDatatoPointData1 = CellDatatoPointData(Input=calculator2)
cellDatatoPointData1.CellDataArraytoprocess = ["gradientMagnitude"]
# create a new 'TTK PointDataSelector'
tTKPointDataSelector1 = TTKPointDataSelector(Input=cellDatatoPointData1)
tTKPointDataSelector1.ScalarFields = ["density", "gradientMagnitude"]
tTKPointDataSelector1.RangeId = [0, 2]
# create a new 'Cell Data to Point Data'
cellDatatoPointData2 = CellDatatoPointData(Input=tTKPointDataSelector1)
cellDatatoPointData2.CellDataArraytoprocess = ["ScalarGradient", "gradientMagnitude"]
# create a new 'Resample To Image'
resampleToImage1 = ResampleToImage(Input=cellDatatoPointData2)
resampleToImage1.SamplingDimensions = [dim, dim, dim]
resampleToImage1.SamplingBounds = [0.0, 176.0, 0.0, 94.0, 0.0, 47.0]
# create a new 'TTK ScalarFieldSmoother'
tTKScalarFieldSmoother1 = TTKScalarFieldSmoother(Input=resampleToImage1)
tTKScalarFieldSmoother1.ScalarField = ["POINTS", "density"]
tTKScalarFieldSmoother1.IterationNumber = 1
# create a new 'TTK ScalarFieldSmoother'
tTKScalarFieldSmoother2 = TTKScalarFieldSmoother(Input=tTKScalarFieldSmoother1)
tTKScalarFieldSmoother2.ScalarField = ["POINTS", "gradientMagnitude"]
tTKScalarFieldSmoother2.IterationNumber = 10
# create a new 'TTK ScalarFieldNormalizer'
tTKScalarFieldNormalizer2 = TTKScalarFieldNormalizer(Input=tTKScalarFieldSmoother2)
tTKScalarFieldNormalizer2.ScalarField = ["POINTS", "density"]
# create a new 'TTK ArrayPreconditioning'
tTKArrayPreconditioning1 = TTKArrayPreconditioning(Input=tTKScalarFieldNormalizer2)
tTKArrayPreconditioning1.PointDataArrays = ["density"]
# create a new 'TTK ScalarFieldCriticalPoints'
tTKScalarFieldCriticalPoints2 = TTKScalarFieldCriticalPoints(
Input=tTKArrayPreconditioning1
)
tTKScalarFieldCriticalPoints2.ScalarField = ["POINTS", "density"]
tTKScalarFieldCriticalPoints2.Backend = "Default generic backend"
# create a new 'Mask Points'
maskPoints2 = MaskPoints(Input=tTKScalarFieldCriticalPoints2)
maskPoints2.OnRatio = 1
maskPoints2.MaximumNumberofPoints = 99999999
maskPoints2.ProportionallyDistributeMaximumNumberOfPoints = 1
maskPoints2.RandomSampling = 1
maskPoints2.RandomSamplingMode = "Random Sampling"
maskPoints2.GenerateVertices = 1
maskPoints2.SingleVertexPerCell = 1
# create a new 'Threshold'
threshold1 = Threshold(Input=maskPoints2)
threshold1.Scalars = ["POINTS", "CriticalType"]
threshold1.LowerThreshold = 1.0
threshold1.UpperThreshold = 1.0
# create a new 'Threshold'
threshold4 = Threshold(Input=threshold1)
threshold4.Scalars = ["POINTS", "IsOnBoundary"]
# create a new 'TTK IntegralLines'
tTKIntegralLines1 = TTKIntegralLines(Domain=tTKArrayPreconditioning1, Seeds=threshold4)
tTKIntegralLines1.ScalarField = ["POINTS", "density"]
tTKIntegralLines1.Direction = "Backward"
tTKIntegralLines1.Vertexidentifierfield = ["POINTS", "CriticalType"]
tTKIntegralLines1.EnableForking = 1
# create a new 'Clean to Grid'
cleantoGrid1 = CleantoGrid(Input=tTKIntegralLines1)
# create a new 'TTK GeometrySmoother'
tTKGeometrySmoother2 = TTKGeometrySmoother(Input=cleantoGrid1)
tTKGeometrySmoother2.IterationNumber = 200
# create a new 'Resample With Dataset'
resampleWithDataset1 = ResampleWithDataset(
SourceDataArrays=cellDatatoPointData1, DestinationMesh=tTKGeometrySmoother2
)
resampleWithDataset1.CellLocator = "Static Cell Locator"
resampleWithDataset1.PassCellArrays = 1
resampleWithDataset1.PassPointArrays = 1
# create a new 'TTK ScalarFieldCriticalPoints'
tTKScalarFieldCriticalPoints1 = TTKScalarFieldCriticalPoints(Input=resampleWithDataset1)
tTKScalarFieldCriticalPoints1.ScalarField = ["POINTS", "gradientMagnitude"]
tTKScalarFieldCriticalPoints1.Backend = "Default generic backend"
UpdatePipeline()
# To save the output to disk, uncomment the two lines below.
#SaveData("integralLines.pvtu", tTKGeometrySmoother2)
#SaveData("criticalPoints.pvtp", tTKScalarFieldCriticalPoints1)
# WARNING: due to a reported ParaView issue, when saving the output to disk in
# MPI mode, pvbatch will execute the pipeline twice in a row (instead of one).
|
To run the above Python script using 2 threads and 4 processes, go to your ttk-data directory and enter the following command:
OMP_NUM_THREADS=2 mpirun --bind-to none --map-by node -n 4 pvbatch python/mpiExample.py
By default, the dataset is resampled to 256^3. To resample to a higher dimension, for example 2048^3, enter the following command:
OMP_NUM_THREADS=2 mpirun --bind-to none --map-by node -n 4 pvbatch python/mpiExample.py 2048
- at.vti: A molecular dataset: a three-dimensional regular grid with one scalar field, the electronic density for the Adenine Thymine complex.
Outputs
integralLines.pvtu: the geometry of the smoothed integral lines capturing the covalent and hydrogen bonds of the molecule, as extracted by the analysis pipeline.criticalPoints.pvtp: the critical points computed on the geometry of the integral lines, showing the rapid changes in the bonds.
C++/Python API
ArrayPreconditioning
GeometrySmoother
IntegralLines
PointDataSelector
ScalarFieldCriticalPoints
ScalarFieldNormalizer
ScalarFieldSmoother