Persistence Clustering Gallery
The Persistence Clustering Gallery is composed of the following examples (from left to right):
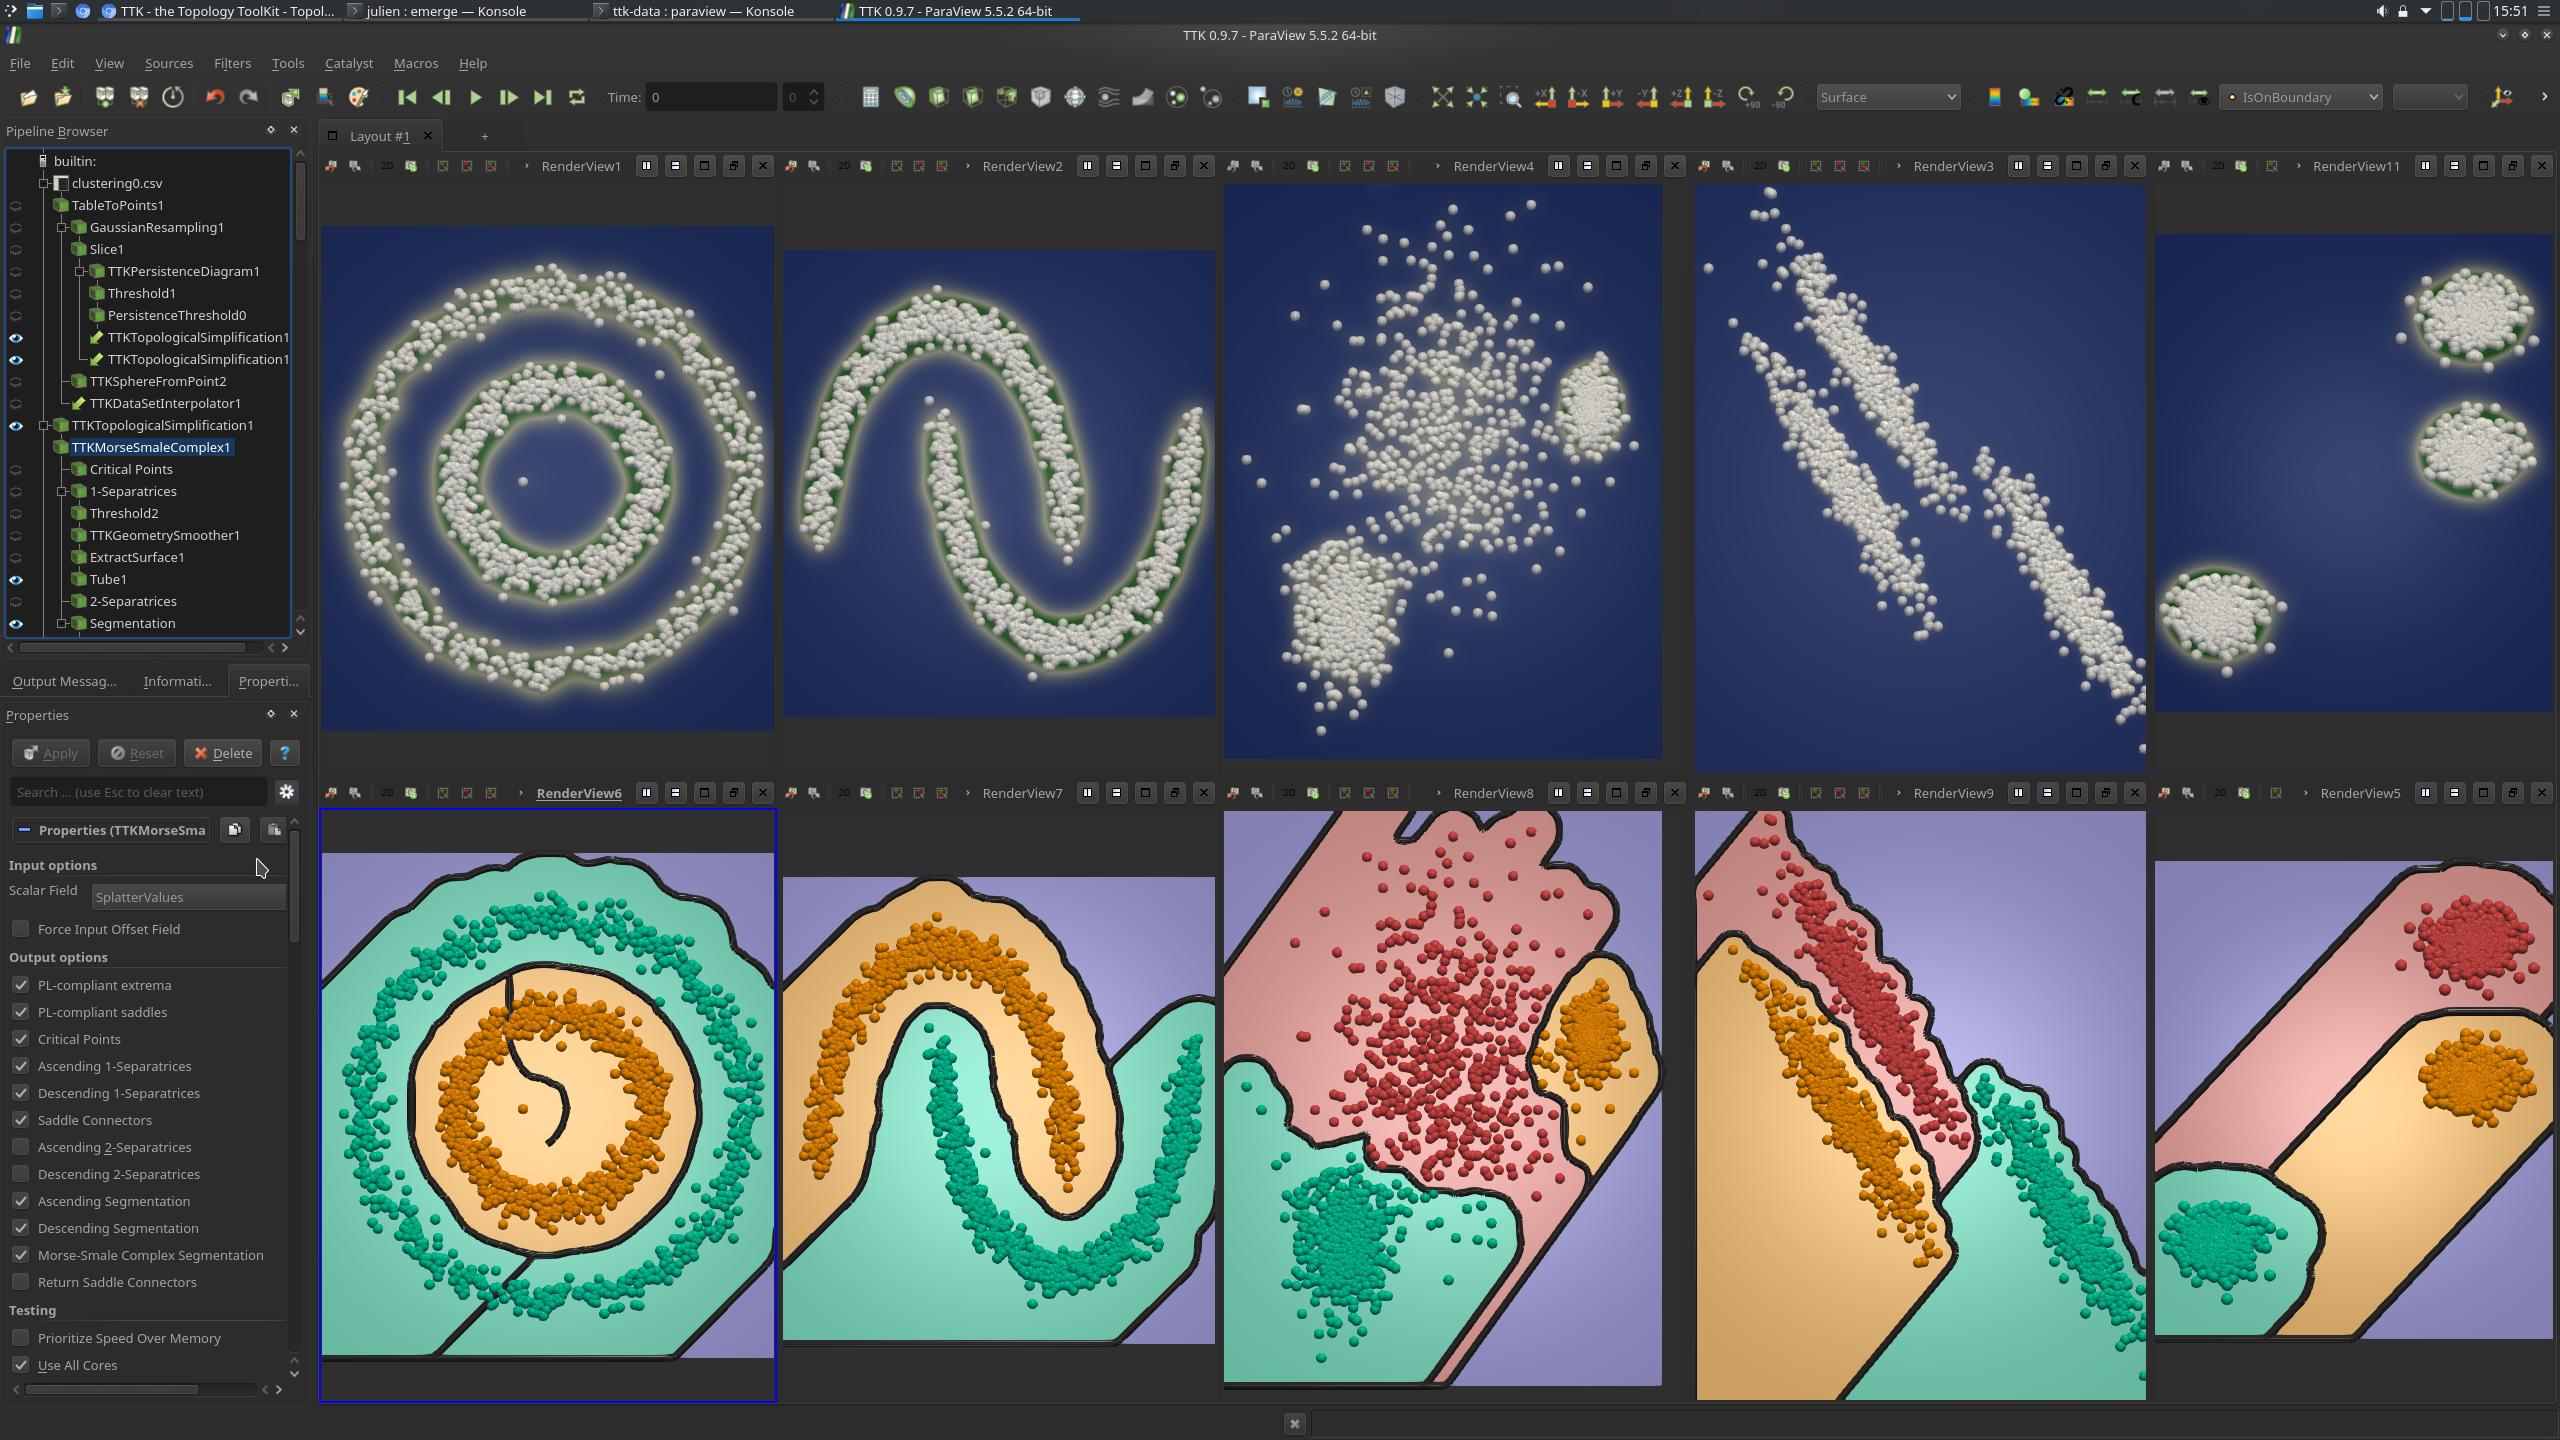
Each example is explained in more details in its own documentation and is shown in the above screenshot in a pair of images, one showing the dataset (upper half), the other showing the results of the pipeline (bottom half).
Pipeline description
All examples of the Gallery have a similar pipeline.
First, it loads a point cloud from disk, then it computes a mesh on which a density field is obtained with a Gaussian Resampling on the points (top view in the above screenshot). This density field will be considered as the input scalar data.
Next, a PersistenceDiagram is computed and thresholds are applied base on persistence to maintain only the features with a persistence above a certain value. The result is a simplified persistence diagram.
The simplified persistence diagram is then used as a constraint for the TopologicalSimplification of the input scalar data, giving us a simplified data.
From there a MorseSmaleComplex is computed (bottom view in the above screenshot) then smoothed. Finally, by using the identifier of the 2-dimension cell of the Morse Smale complex where one point lands, a cluster is given to it.
ParaView
To reproduce the above screenshot, go to your ttk-data directory and enter the following command:
paraview states/persistenceClusteringGallery.pvsm
Python code
Persistence clusering 0
 1
 2
 3
 4
 5
 6
 7
 8
 9
10
11
12
13
14
15
16
17
18
19
20
21
22
23
24
25
26
27
28
29
30
31
32
33
34
35
36
37
38
39
40
41
42
43
44
45
46
47
48
49
50
51
52
53
54
55
56
57 | #!/usr/bin/env python
from paraview.simple import *
# create a new 'CSV Reader'
clustering0csv = CSVReader(FileName=["clustering0.csv"])
# create a new 'Table To Points'
tableToPoints1 = TableToPoints(Input=clustering0csv)
tableToPoints1.XColumn = "X"
tableToPoints1.YColumn = "Y"
tableToPoints1.a2DPoints = 1
tableToPoints1.KeepAllDataArrays = 1
# create a new 'Gaussian Resampling'
gaussianResampling1 = GaussianResampling(Input=tableToPoints1)
gaussianResampling1.ResampleField = ["POINTS", "ignore arrays"]
gaussianResampling1.ResamplingGrid = [256, 256, 3]
gaussianResampling1.SplatAccumulationMode = "Sum"
# create a new 'Slice'
slice1 = Slice(Input=gaussianResampling1)
slice1.SliceType = "Plane"
# init the 'Plane' selected for 'SliceType'
slice1.SliceType.Normal = [0.0, 0.0, 1.0]
# create a new 'TTK PersistenceDiagram'
tTKPersistenceDiagram1 = TTKPersistenceDiagram(Input=slice1)
tTKPersistenceDiagram1.ScalarField = ["POINTS", "SplatterValues"]
tTKPersistenceDiagram1.IgnoreBoundary = False
# create a new 'Threshold'
persistenceThreshold0 = Threshold(Input=tTKPersistenceDiagram1)
persistenceThreshold0.Scalars = ["CELLS", "Persistence"]
persistenceThreshold0.ThresholdMethod = "Between"
persistenceThreshold0.LowerThreshold = 10.0
persistenceThreshold0.UpperThreshold = 999999999
# create a new 'TTK TopologicalSimplification'
tTKTopologicalSimplification1 = TTKTopologicalSimplification(
Domain=slice1, Constraints=persistenceThreshold0
)
tTKTopologicalSimplification1.ScalarField = ["POINTS", "SplatterValues"]
# create a new 'TTK MorseSmaleComplex'
tTKMorseSmaleComplex1 = TTKMorseSmaleComplex(Input=tTKTopologicalSimplification1)
tTKMorseSmaleComplex1.ScalarField = ["POINTS", "SplatterValues"]
# create a new 'Resample With Dataset'
resampleWithDataset1 = ResampleWithDataset(
SourceDataArrays=OutputPort(tTKMorseSmaleComplex1, 3),
DestinationMesh=tableToPoints1,
)
resampleWithDataset1.CellLocator = "Static Cell Locator"
SaveData("OutputClustering.csv", resampleWithDataset1)
|
To run the above Python script, go to your ttk-data directory and enter the following command:
pvpython python/persistenceClustering0.py
Persistence clusering 1
 1
 2
 3
 4
 5
 6
 7
 8
 9
10
11
12
13
14
15
16
17
18
19
20
21
22
23
24
25
26
27
28
29
30
31
32
33
34
35
36
37
38
39
40
41
42
43
44
45
46
47
48
49
50
51
52
53
54
55
56
57
58
59
60
61
62 | from paraview.simple import *
# create a new 'CSV Reader'
clusteringcsv = CSVReader(FileName=["clustering1.csv"])
# create a new 'Table To Points'
tableToPoints1 = TableToPoints(Input=clusteringcsv)
tableToPoints1.XColumn = "X"
tableToPoints1.YColumn = "Y"
tableToPoints1.a2DPoints = 1
tableToPoints1.KeepAllDataArrays = 1
# create a new 'Gaussian Resampling'
gaussianResampling1 = GaussianResampling(Input=tableToPoints1)
gaussianResampling1.ResampleField = ["POINTS", "ignore arrays"]
gaussianResampling1.ResamplingGrid = [256, 256, 3]
gaussianResampling1.SplatAccumulationMode = "Sum"
# create a new 'Slice'
slice1 = Slice(Input=gaussianResampling1)
slice1.SliceType = "Plane"
# init the 'Plane' selected for 'SliceType'
slice1.SliceType.Normal = [0.0, 0.0, 1.0]
# create a new 'TTK PersistenceDiagram'
tTKPersistenceDiagram1 = TTKPersistenceDiagram(Input=slice1)
tTKPersistenceDiagram1.ScalarField = ["POINTS", "SplatterValues"]
tTKPersistenceDiagram1.IgnoreBoundary = False
# create a new 'Threshold'
threshold1 = Threshold(Input=tTKPersistenceDiagram1)
threshold1.Scalars = ["CELLS", "PairIdentifier"]
threshold1.ThresholdMethod = "Between"
threshold1.LowerThreshold = -0.1
threshold1.UpperThreshold = 999999999
# create a new 'Threshold'
persistenceThreshold0 = Threshold(Input=threshold1)
persistenceThreshold0.Scalars = ["CELLS", "Persistence"]
persistenceThreshold0.ThresholdMethod = "Between"
persistenceThreshold0.LowerThreshold = 10.0
persistenceThreshold0.UpperThreshold = 999999999
# create a new 'TTK TopologicalSimplification'
tTKTopologicalSimplification1 = TTKTopologicalSimplification(
Domain=slice1, Constraints=persistenceThreshold0
)
tTKTopologicalSimplification1.ScalarField = ["POINTS", "SplatterValues"]
# create a new 'TTK MorseSmaleComplex'
tTKMorseSmaleComplex1 = TTKMorseSmaleComplex(Input=tTKTopologicalSimplification1)
tTKMorseSmaleComplex1.ScalarField = ["POINTS", "SplatterValues"]
# create a new 'Resample With Dataset'
resampleWithDataset1 = ResampleWithDataset(
SourceDataArrays=OutputPort(tTKMorseSmaleComplex1, 3),
DestinationMesh=tableToPoints1,
)
# save the output(s)
SaveData("OutputClustering.csv", resampleWithDataset1)
|
To run the above Python script, go to your ttk-data directory and enter the following command:
pvpython python/persistenceClustering1.py
Persistence clusering 2
 1
 2
 3
 4
 5
 6
 7
 8
 9
10
11
12
13
14
15
16
17
18
19
20
21
22
23
24
25
26
27
28
29
30
31
32
33
34
35
36
37
38
39
40
41
42
43
44
45
46
47
48
49
50
51
52
53
54
55
56
57
58
59
60
61
62
63 | from paraview.simple import *
# create a new 'CSV Reader'
clusteringcsv = CSVReader(FileName=["clustering2.csv"])
# create a new 'Table To Points'
tableToPoints1 = TableToPoints(Input=clusteringcsv)
tableToPoints1.XColumn = "X"
tableToPoints1.YColumn = "Y"
tableToPoints1.a2DPoints = 1
tableToPoints1.KeepAllDataArrays = 1
# create a new 'Gaussian Resampling'
gaussianResampling1 = GaussianResampling(Input=tableToPoints1)
gaussianResampling1.ResampleField = ["POINTS", "ignore arrays"]
gaussianResampling1.ResamplingGrid = [256, 256, 3]
gaussianResampling1.GaussianSplatRadius = 0.05
gaussianResampling1.SplatAccumulationMode = "Sum"
# create a new 'Slice'
slice1 = Slice(Input=gaussianResampling1)
slice1.SliceType = "Plane"
# init the 'Plane' selected for 'SliceType'
slice1.SliceType.Normal = [0.0, 0.0, 1.0]
# create a new 'TTK PersistenceDiagram'
tTKPersistenceDiagram1 = TTKPersistenceDiagram(Input=slice1)
tTKPersistenceDiagram1.ScalarField = ["POINTS", "SplatterValues"]
tTKPersistenceDiagram1.IgnoreBoundary = False
# create a new 'Threshold'
threshold1 = Threshold(Input=tTKPersistenceDiagram1)
threshold1.Scalars = ["CELLS", "PairIdentifier"]
threshold1.ThresholdMethod = "Between"
threshold1.LowerThreshold = -0.1
threshold1.UpperThreshold = 999999999
# create a new 'Threshold'
persistenceThreshold0 = Threshold(Input=threshold1)
persistenceThreshold0.Scalars = ["CELLS", "Persistence"]
persistenceThreshold0.ThresholdMethod = "Between"
persistenceThreshold0.LowerThreshold = 5.0
persistenceThreshold0.UpperThreshold = 999999999
# create a new 'TTK TopologicalSimplification'
tTKTopologicalSimplification1 = TTKTopologicalSimplification(
Domain=slice1, Constraints=persistenceThreshold0
)
tTKTopologicalSimplification1.ScalarField = ["POINTS", "SplatterValues"]
# create a new 'TTK MorseSmaleComplex'
tTKMorseSmaleComplex1 = TTKMorseSmaleComplex(Input=tTKTopologicalSimplification1)
tTKMorseSmaleComplex1.ScalarField = ["POINTS", "SplatterValues"]
# create a new 'Resample With Dataset'
resampleWithDataset1 = ResampleWithDataset(
SourceDataArrays=OutputPort(tTKMorseSmaleComplex1, 3),
DestinationMesh=tableToPoints1,
)
# save the output(s)
SaveData("OutputClustering.csv", resampleWithDataset1)
|
To run the above Python script, go to your ttk-data directory and enter the following command:
pvpython python/persistenceClustering2.py
Persistence clusering 3
 1
 2
 3
 4
 5
 6
 7
 8
 9
10
11
12
13
14
15
16
17
18
19
20
21
22
23
24
25
26
27
28
29
30
31
32
33
34
35
36
37
38
39
40
41
42
43
44
45
46
47
48
49
50
51
52
53
54
55
56
57
58
59
60
61
62 | from paraview.simple import *
# create a new 'CSV Reader'
clusteringcsv = CSVReader(FileName=["clustering3.csv"])
# create a new 'Table To Points'
tableToPoints1 = TableToPoints(Input=clusteringcsv)
tableToPoints1.XColumn = "X"
tableToPoints1.YColumn = "Y"
tableToPoints1.a2DPoints = 1
tableToPoints1.KeepAllDataArrays = 1
# create a new 'Gaussian Resampling'
gaussianResampling1 = GaussianResampling(Input=tableToPoints1)
gaussianResampling1.ResampleField = ["POINTS", "ignore arrays"]
gaussianResampling1.ResamplingGrid = [256, 256, 3]
gaussianResampling1.SplatAccumulationMode = "Sum"
# create a new 'Slice'
slice1 = Slice(Input=gaussianResampling1)
slice1.SliceType = "Plane"
# init the 'Plane' selected for 'SliceType'
slice1.SliceType.Normal = [0.0, 0.0, 1.0]
# create a new 'TTK PersistenceDiagram'
tTKPersistenceDiagram1 = TTKPersistenceDiagram(Input=slice1)
tTKPersistenceDiagram1.ScalarField = ["POINTS", "SplatterValues"]
tTKPersistenceDiagram1.IgnoreBoundary = False
# create a new 'Threshold'
threshold1 = Threshold(Input=tTKPersistenceDiagram1)
threshold1.Scalars = ["CELLS", "PairIdentifier"]
threshold1.ThresholdMethod = "Between"
threshold1.LowerThreshold = -0.1
threshold1.UpperThreshold = 999999999
# create a new 'Threshold'
persistenceThreshold0 = Threshold(Input=threshold1)
persistenceThreshold0.Scalars = ["CELLS", "Persistence"]
persistenceThreshold0.ThresholdMethod = "Between"
persistenceThreshold0.LowerThreshold = 10.0
persistenceThreshold0.UpperThreshold = 999999999
# create a new 'TTK TopologicalSimplification'
tTKTopologicalSimplification1 = TTKTopologicalSimplification(
Domain=slice1, Constraints=persistenceThreshold0
)
tTKTopologicalSimplification1.ScalarField = ["POINTS", "SplatterValues"]
# create a new 'TTK MorseSmaleComplex'
tTKMorseSmaleComplex1 = TTKMorseSmaleComplex(Input=tTKTopologicalSimplification1)
tTKMorseSmaleComplex1.ScalarField = ["POINTS", "SplatterValues"]
# create a new 'Resample With Dataset'
resampleWithDataset1 = ResampleWithDataset(
SourceDataArrays=OutputPort(tTKMorseSmaleComplex1, 3),
DestinationMesh=tableToPoints1,
)
# save the output(s)
SaveData("OutputClustering.csv", resampleWithDataset1)
|
To run the above Python script, go to your ttk-data directory and enter the following command:
pvpython python/persistenceClustering3.py
Persistence clusering 4
 1
 2
 3
 4
 5
 6
 7
 8
 9
10
11
12
13
14
15
16
17
18
19
20
21
22
23
24
25
26
27
28
29
30
31
32
33
34
35
36
37
38
39
40
41
42
43
44
45
46
47
48
49
50
51
52
53
54
55
56
57
58
59
60
61 | from paraview.simple import *
# create a new 'CSV Reader'
clusteringcsv = CSVReader(FileName=["clustering4.csv"])
# create a new 'Table To Points'
tableToPoints1 = TableToPoints(Input=clusteringcsv)
tableToPoints1.XColumn = "X"
tableToPoints1.YColumn = "Y"
tableToPoints1.a2DPoints = 1
tableToPoints1.KeepAllDataArrays = 1
# create a new 'Gaussian Resampling'
gaussianResampling1 = GaussianResampling(Input=tableToPoints1)
gaussianResampling1.ResampleField = ["POINTS", "ignore arrays"]
gaussianResampling1.ResamplingGrid = [256, 256, 3]
gaussianResampling1.SplatAccumulationMode = "Sum"
# create a new 'Slice'
slice1 = Slice(Input=gaussianResampling1)
slice1.SliceType = "Plane"
# init the 'Plane' selected for 'SliceType'
slice1.SliceType.Normal = [0.0, 0.0, 1.0]
# create a new 'TTK PersistenceDiagram'
tTKPersistenceDiagram1 = TTKPersistenceDiagram(Input=slice1)
tTKPersistenceDiagram1.ScalarField = ["POINTS", "SplatterValues"]
# create a new 'Threshold'
threshold1 = Threshold(Input=tTKPersistenceDiagram1)
threshold1.Scalars = ["CELLS", "PairIdentifier"]
threshold1.ThresholdMethod = "Between"
threshold1.LowerThreshold = -0.1
threshold1.UpperThreshold = 999999999
# create a new 'Threshold'
persistenceThreshold0 = Threshold(Input=threshold1)
persistenceThreshold0.Scalars = ["CELLS", "Persistence"]
persistenceThreshold0.ThresholdMethod = "Between"
persistenceThreshold0.LowerThreshold = 10.0
persistenceThreshold0.UpperThreshold = 999999999
# create a new 'TTK TopologicalSimplification'
tTKTopologicalSimplification1 = TTKTopologicalSimplification(
Domain=slice1, Constraints=persistenceThreshold0
)
tTKTopologicalSimplification1.ScalarField = ["POINTS", "SplatterValues"]
# create a new 'TTK MorseSmaleComplex'
tTKMorseSmaleComplex1 = TTKMorseSmaleComplex(Input=tTKTopologicalSimplification1)
tTKMorseSmaleComplex1.ScalarField = ["POINTS", "SplatterValues"]
# create a new 'Resample With Dataset'
resampleWithDataset1 = ResampleWithDataset(
SourceDataArrays=OutputPort(tTKMorseSmaleComplex1, 3),
DestinationMesh=tableToPoints1,
)
# save the output(s)
SaveData("OutputClustering.csv", resampleWithDataset1)
|
To run the above Python script, go to your ttk-data directory and enter the following command:
pvpython python/persistenceClustering4.py
C++/Python API
GeometrySmoother
PersistenceDiagram
TopologicalSimplification
MorseSmaleComplex