Time Tracking
Pipeline description
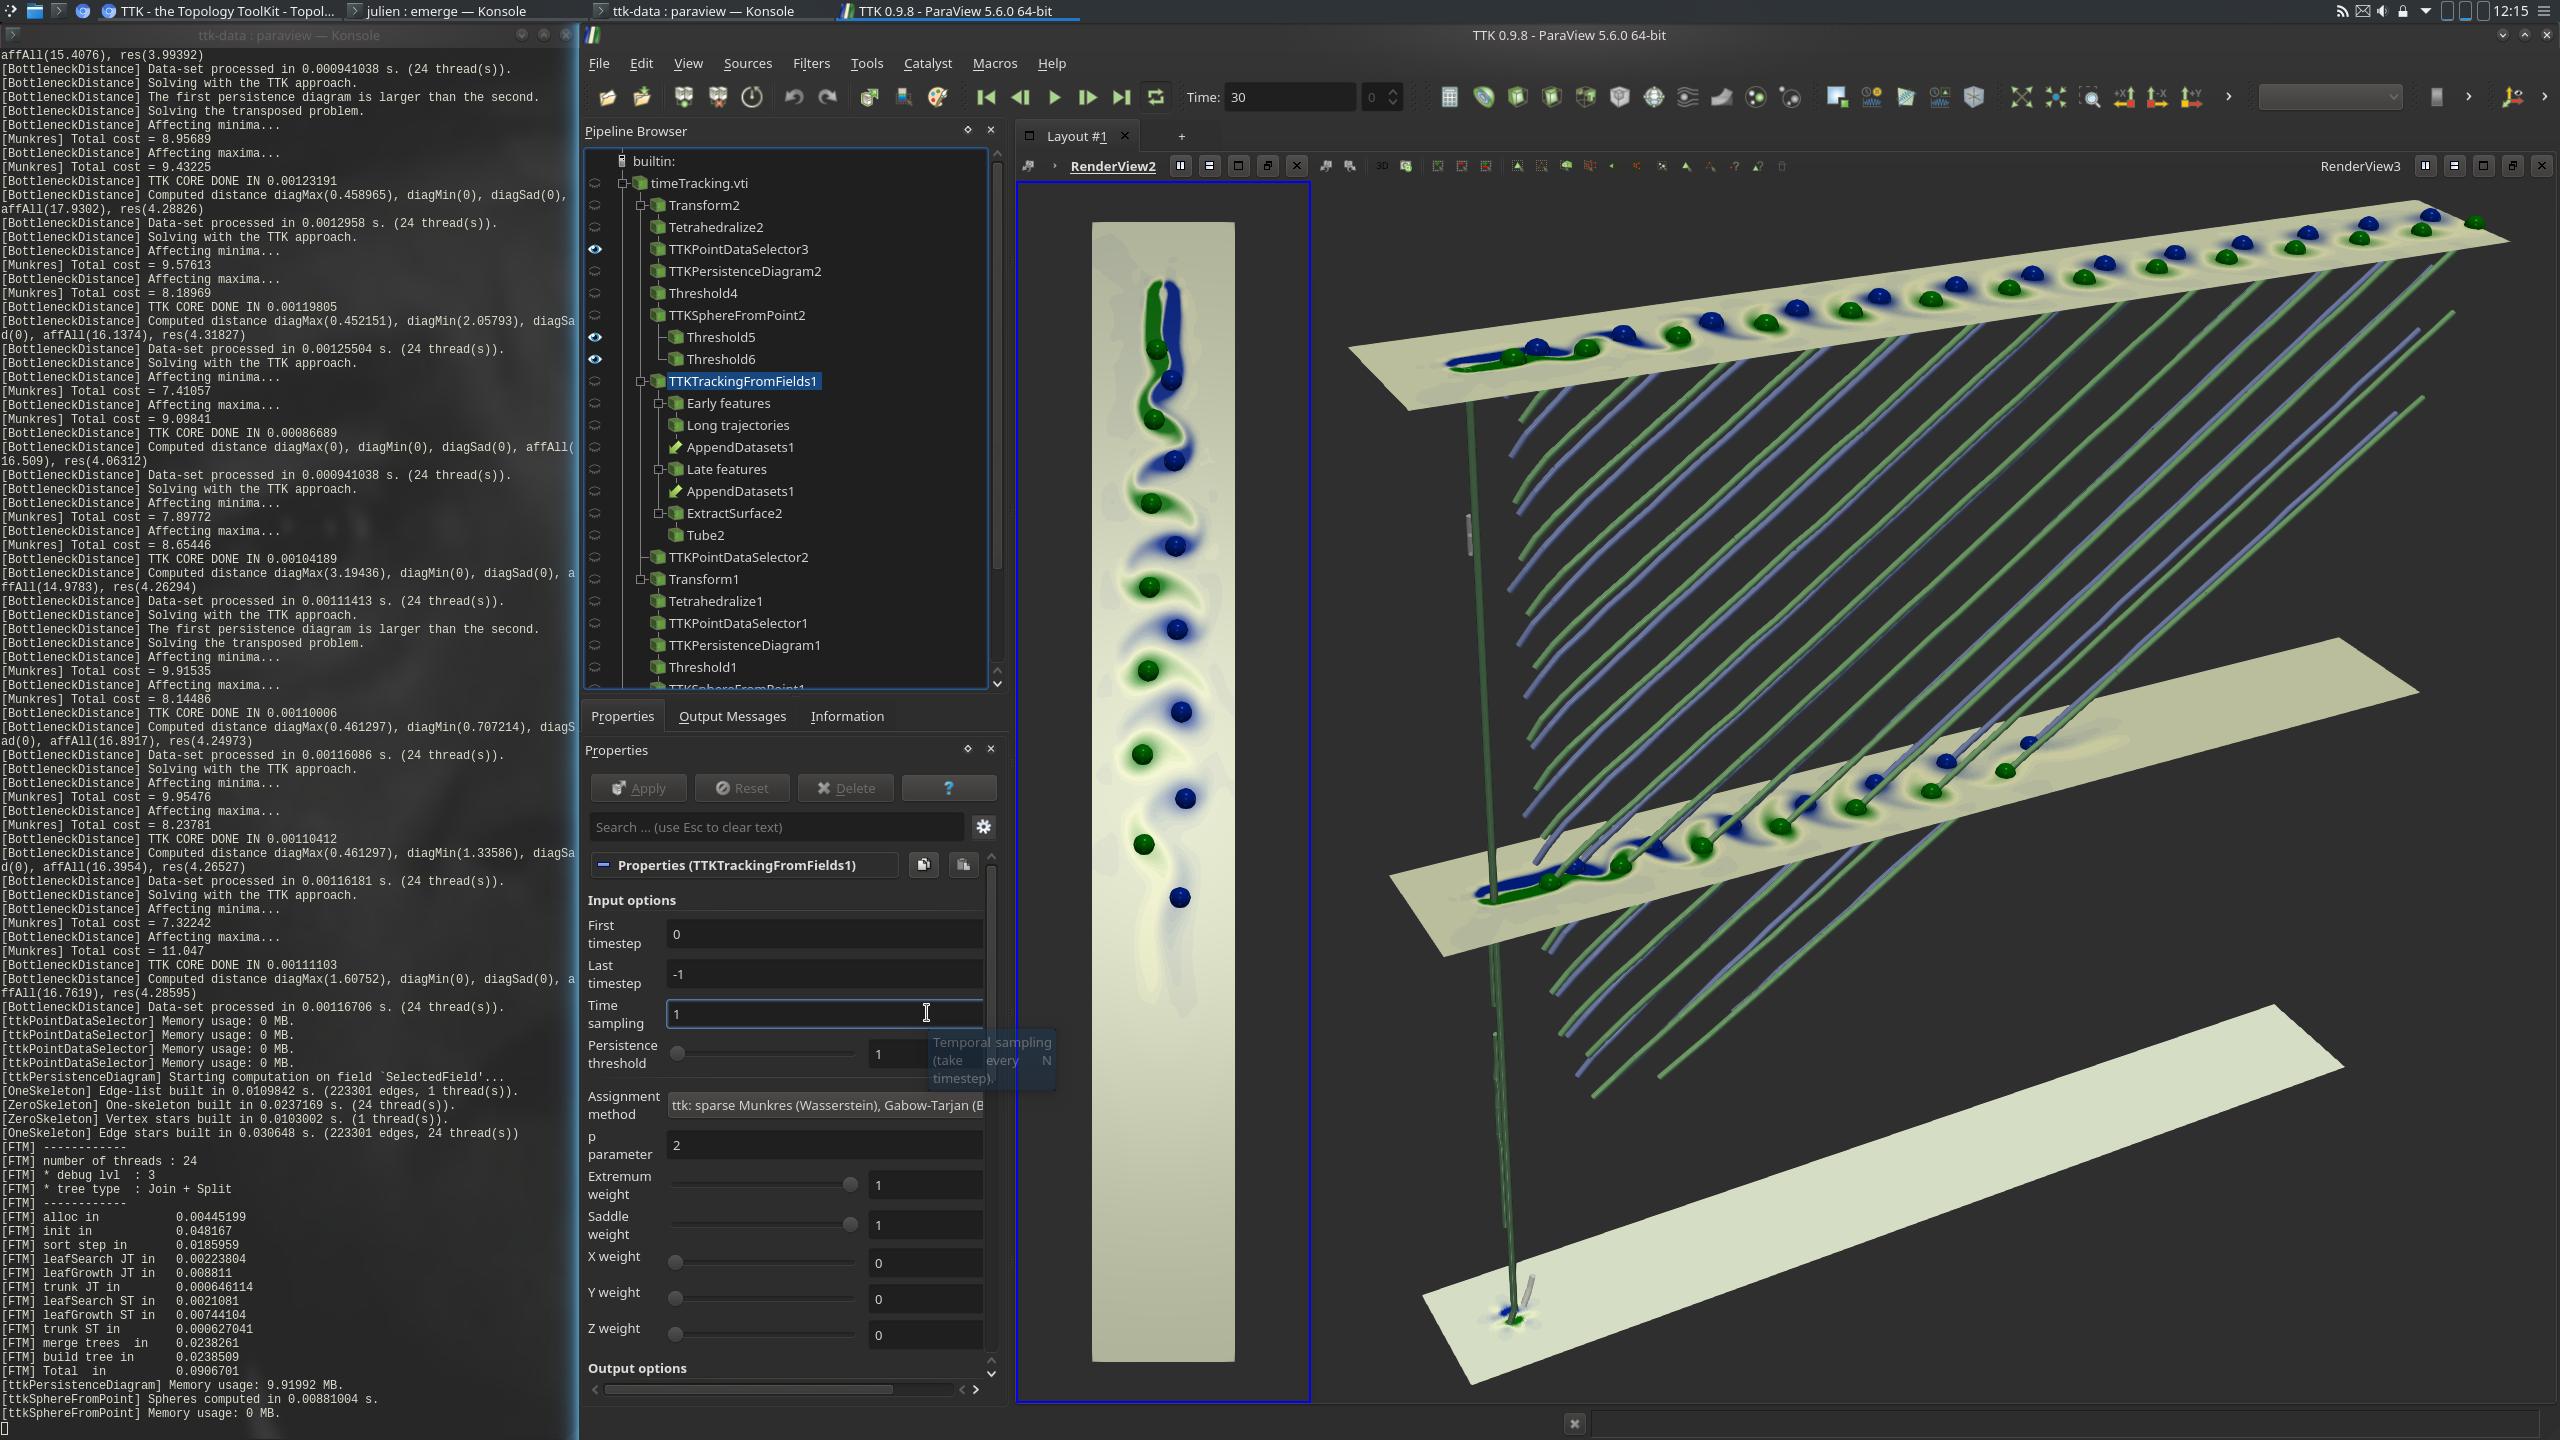
This example loads a 2D time-dependent scalar field, where time steps are stored as a sequence of data arrays.
Using TrackingFromFields, a tracking mesh for the temporal evolution of critical points is computed. This filter computes an optimal matching between persistence diagrams (with respect to Wasserstein metric), and discards critical point pairs below a persistence of 1% by default (parameter Tolerance).
The state file further contains an animation of the critical points over time.
ParaView
To reproduce the above screenshot, go to your ttk-data directory and enter the following command:
paraview states/timeTracking.pvsm
Python code
 1
 2
 3
 4
 5
 6
 7
 8
 9
10
11
12
13
14
15
16
17
18
19
20
21
22
23
24
25
26
27
28
29
30
31
32
33
34
35 | #!/usr/bin/env python
from paraview.simple import *
# create a new 'XML Image Data Reader'
timeTrackingvti = XMLImageDataReader(FileName=["timeTracking.vti"])
timeTrackingvti.CellArrayStatus = []
# select data arrays 000, 002, 004, ..., 118
timeTrackingvti.PointArrayStatus = ["{:0>3}".format(i) for i in range(0, 120, 2)]
# create a new 'TTK TrackingFromFields'
tTKTrackingFromFields1 = TTKTrackingFromFields(Input=timeTrackingvti)
tTKTrackingFromFields1.ForceZtranslation = 1
tTKTrackingFromFields1.ZTranslation = 0.125
tTKTrackingFromFields1.Fweight = 1
# create a new 'Threshold', get the minimum trajectories
threshold1 = Threshold(Input=tTKTrackingFromFields1)
threshold1.Scalars = "CriticalType"
threshold1.LowerThreshold = 0.0
threshold1.UpperThreshold = 0.0
# create a new 'Threshold', get the maximum trajectories
threshold2 = Threshold(Input=tTKTrackingFromFields1)
threshold2.Scalars = "CriticalType"
threshold2.LowerThreshold = 3.0
threshold2.UpperThreshold = 3.0
# group minima and maxima trajectories
appendDatasets1 = AppendDatasets(Input=[threshold1, threshold2])
# create a new 'Extract Surface'
extractSurface1 = ExtractSurface(Input=appendDatasets1)
# save the output
SaveData("timeTracking.vtp", extractSurface1)
|
To run the above Python script, go to your ttk-data directory and enter the following command:
pvpython python/timeTracking.py
- timeTracking.vti: time-dependent vorticity of a 2D vortex street, with time steps represented by data arrays '000', '002', ..., '118'
Outputs
timeTracking.vtp: tracking mesh of critical points
C++/Python API
TrackingFromFields