1-Manifold Learning
Pipeline description
This example first loads a point cloud from disk.
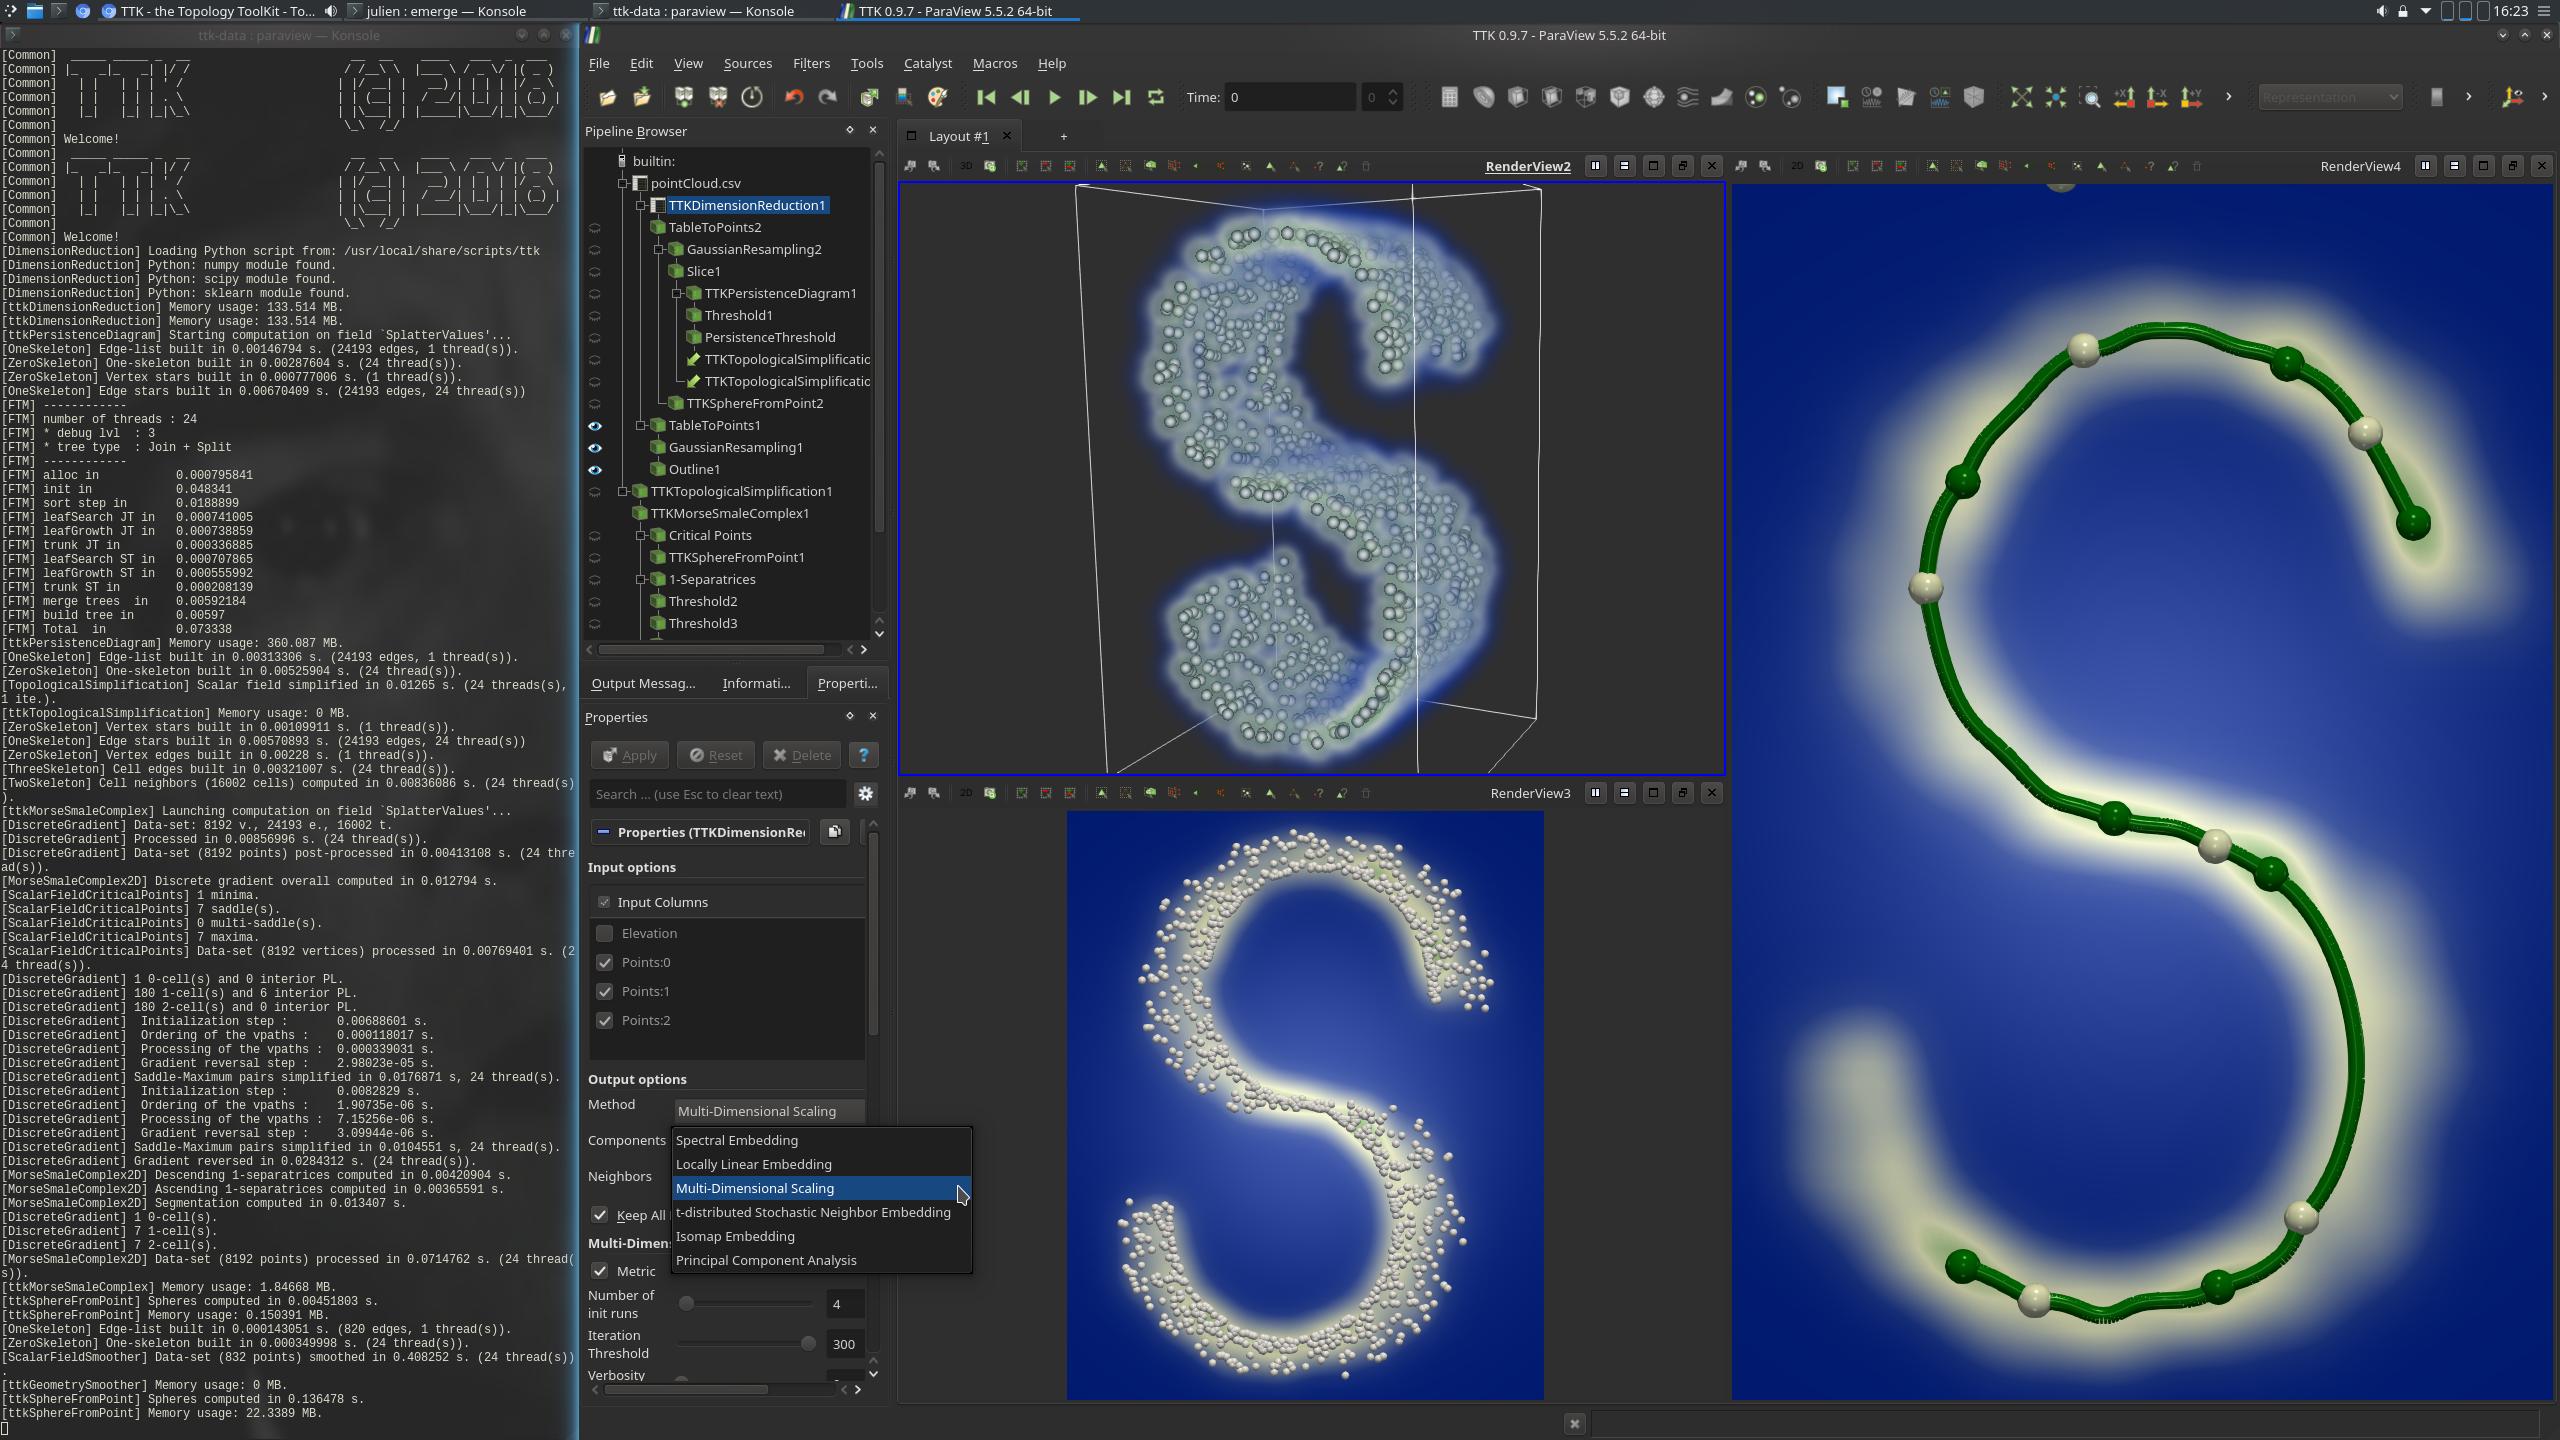
In a pre-processing, the DimensionReduction is used to reduce the dimension of the input to 2D points. The data is then converted to a format understandable by Paraview using the TableToPoints filter. GaussianResampling is applied to the data (upper left view in the above screenshot). This filter has the effect of injecting input points to a structured data. For each injection, each point will "splat", or distribute values to nearby vertices. The resulting SplatterValues field is a density estimation (with a Gaussian kernel) of the point cloud projected in 2D.
Then, the PersistenceDiagram of a slice of the obtained data is computed and thresholds are applied based on persistence to maintain only the most persistent features. This results in a simplified persistence diagram.
The simplified persistence diagram is then used as a constraint for the TopologicalSimplification of the input scalar data.
This simplified data is then used as the input of the computation of MorseSmaleComplex (right view, above screenshot). This complex is composed of elements of 3 dimensions: dimension 0, which corresponds to the critical points of the Morse-Smale Complex, dimension 1, which corresponds to its edges and dimension 2, which corresponds to its surfaces. Only certain maximal edges are displayed here: using thresholds, the edges connecting at least one critical point situated in the boundary are discarded. This way, the "S" shape made by the point cloud is outlined.
ParaView
To reproduce the above screenshot, go to your ttk-data directory and enter the following command:
paraview states/1manifoldLearning.pvsm
Python code
 1
 2
 3
 4
 5
 6
 7
 8
 9
10
11
12
13
14
15
16
17
18
19
20
21
22
23
24
25
26
27
28
29
30
31
32
33
34
35
36
37
38
39
40
41
42
43
44
45
46
47
48
49
50
51
52
53
54
55
56
57
58
59
60
61
62
63
64
65
66
67
68
69
70
71
72
73
74
75
76
77
78
79
80
81
82 | #!/usr/bin/env python
from paraview.simple import *
# create a new 'CSV Reader'
pointCloudcsv = CSVReader(FileName=["pointCloud.csv"])
# create a new 'TTK DimensionReduction'
tTKDimensionReduction1 = TTKDimensionReduction(
Input=pointCloudcsv, ModulePath="default"
)
tTKDimensionReduction1.InputColumns = ["Points:0", "Points:1", "Points:2"]
tTKDimensionReduction1.UseAllCores = 0
# create a new 'Table To Points'
tableToPoints2 = TableToPoints(Input=tTKDimensionReduction1)
tableToPoints2.XColumn = "Component_0"
tableToPoints2.YColumn = "Component_1"
tableToPoints2.a2DPoints = 1
# create a new 'Gaussian Resampling'
gaussianResampling2 = GaussianResampling(Input=tableToPoints2)
gaussianResampling2.ResampleField = ["POINTS", "ignore arrays"]
gaussianResampling2.ResamplingGrid = [128, 64, 3]
gaussianResampling2.SplatAccumulationMode = "Sum"
# create a new 'Python Calculator'
pythonCalculator1 = PythonCalculator(Input=gaussianResampling2)
pythonCalculator1.Expression = 'numpy.round_(inputs[0].PointData["SplatterValues"], 6)'
pythonCalculator1.ArrayName = "SplatterValues"
# create a new 'Slice'
slice1 = Slice(Input=pythonCalculator1)
slice1.SliceType = "Plane"
# init the 'Plane' selected for 'SliceType'
slice1.SliceType.Normal = [0.0, 0.0, 1.0]
# create a new 'TTK PersistenceDiagram'
tTKPersistenceDiagram1 = TTKPersistenceDiagram(Input=slice1)
tTKPersistenceDiagram1.ScalarField = ["POINTS", "SplatterValues"]
# create a new 'Threshold'
threshold1 = Threshold(Input=tTKPersistenceDiagram1)
threshold1.Scalars = ["CELLS", "PairIdentifier"]
threshold1.ThresholdMethod = "Between"
threshold1.LowerThreshold = -0.1
threshold1.UpperThreshold = 999999999
# create a new 'Threshold'
persistenceThreshold = Threshold(Input=threshold1)
persistenceThreshold.Scalars = ["CELLS", "Persistence"]
persistenceThreshold.ThresholdMethod = "Between"
persistenceThreshold.LowerThreshold = 3.0
persistenceThreshold.UpperThreshold = 999999999
# create a new 'TTK TopologicalSimplification'
tTKTopologicalSimplification1 = TTKTopologicalSimplification(
Domain=slice1, Constraints=persistenceThreshold
)
tTKTopologicalSimplification1.ScalarField = ["POINTS", "SplatterValues"]
# create a new 'TTK MorseSmaleComplex'
tTKMorseSmaleComplex1 = TTKMorseSmaleComplex(Input=tTKTopologicalSimplification1)
tTKMorseSmaleComplex1.ScalarField = ["POINTS", "SplatterValues"]
# create a new 'Threshold'
threshold2 = Threshold(Input=OutputPort(tTKMorseSmaleComplex1, 1))
threshold2.Scalars = ["CELLS", "SeparatrixType"]
threshold2.ThresholdMethod = "Between"
threshold2.LowerThreshold = 1.0
threshold2.UpperThreshold = 1.0
# create a new 'Threshold'
threshold3 = Threshold(Input=threshold2)
threshold3.Scalars = ["CELLS", "NumberOfCriticalPointsOnBoundary"]
# create a new 'TTK GeometrySmoother'
tTKGeometrySmoother1 = TTKGeometrySmoother(Input=threshold3)
tTKGeometrySmoother1.IterationNumber = 100
SaveData("OutputArc.vtu", tTKGeometrySmoother1)
|
To run the above Python script, go to your ttk-data directory and enter the following command:
pvpython python/1manifoldLearning.py
Outputs
OutputArc.vtu: edges (or 1 dimensional elements) of the output Morse Smale Complex that are not connected to any boundary critical point in VTK file format (right view, above screenshot). You are free to change the vtp file extension to that of any other supported file format (e.g. csv) in the above python script.
C++/Python API
DimensionReduction
GeometrySmoother
MorseSmaleComplex
PersistenceDiagram
TopologicalSimplification