Builtin example 1
Pipeline description
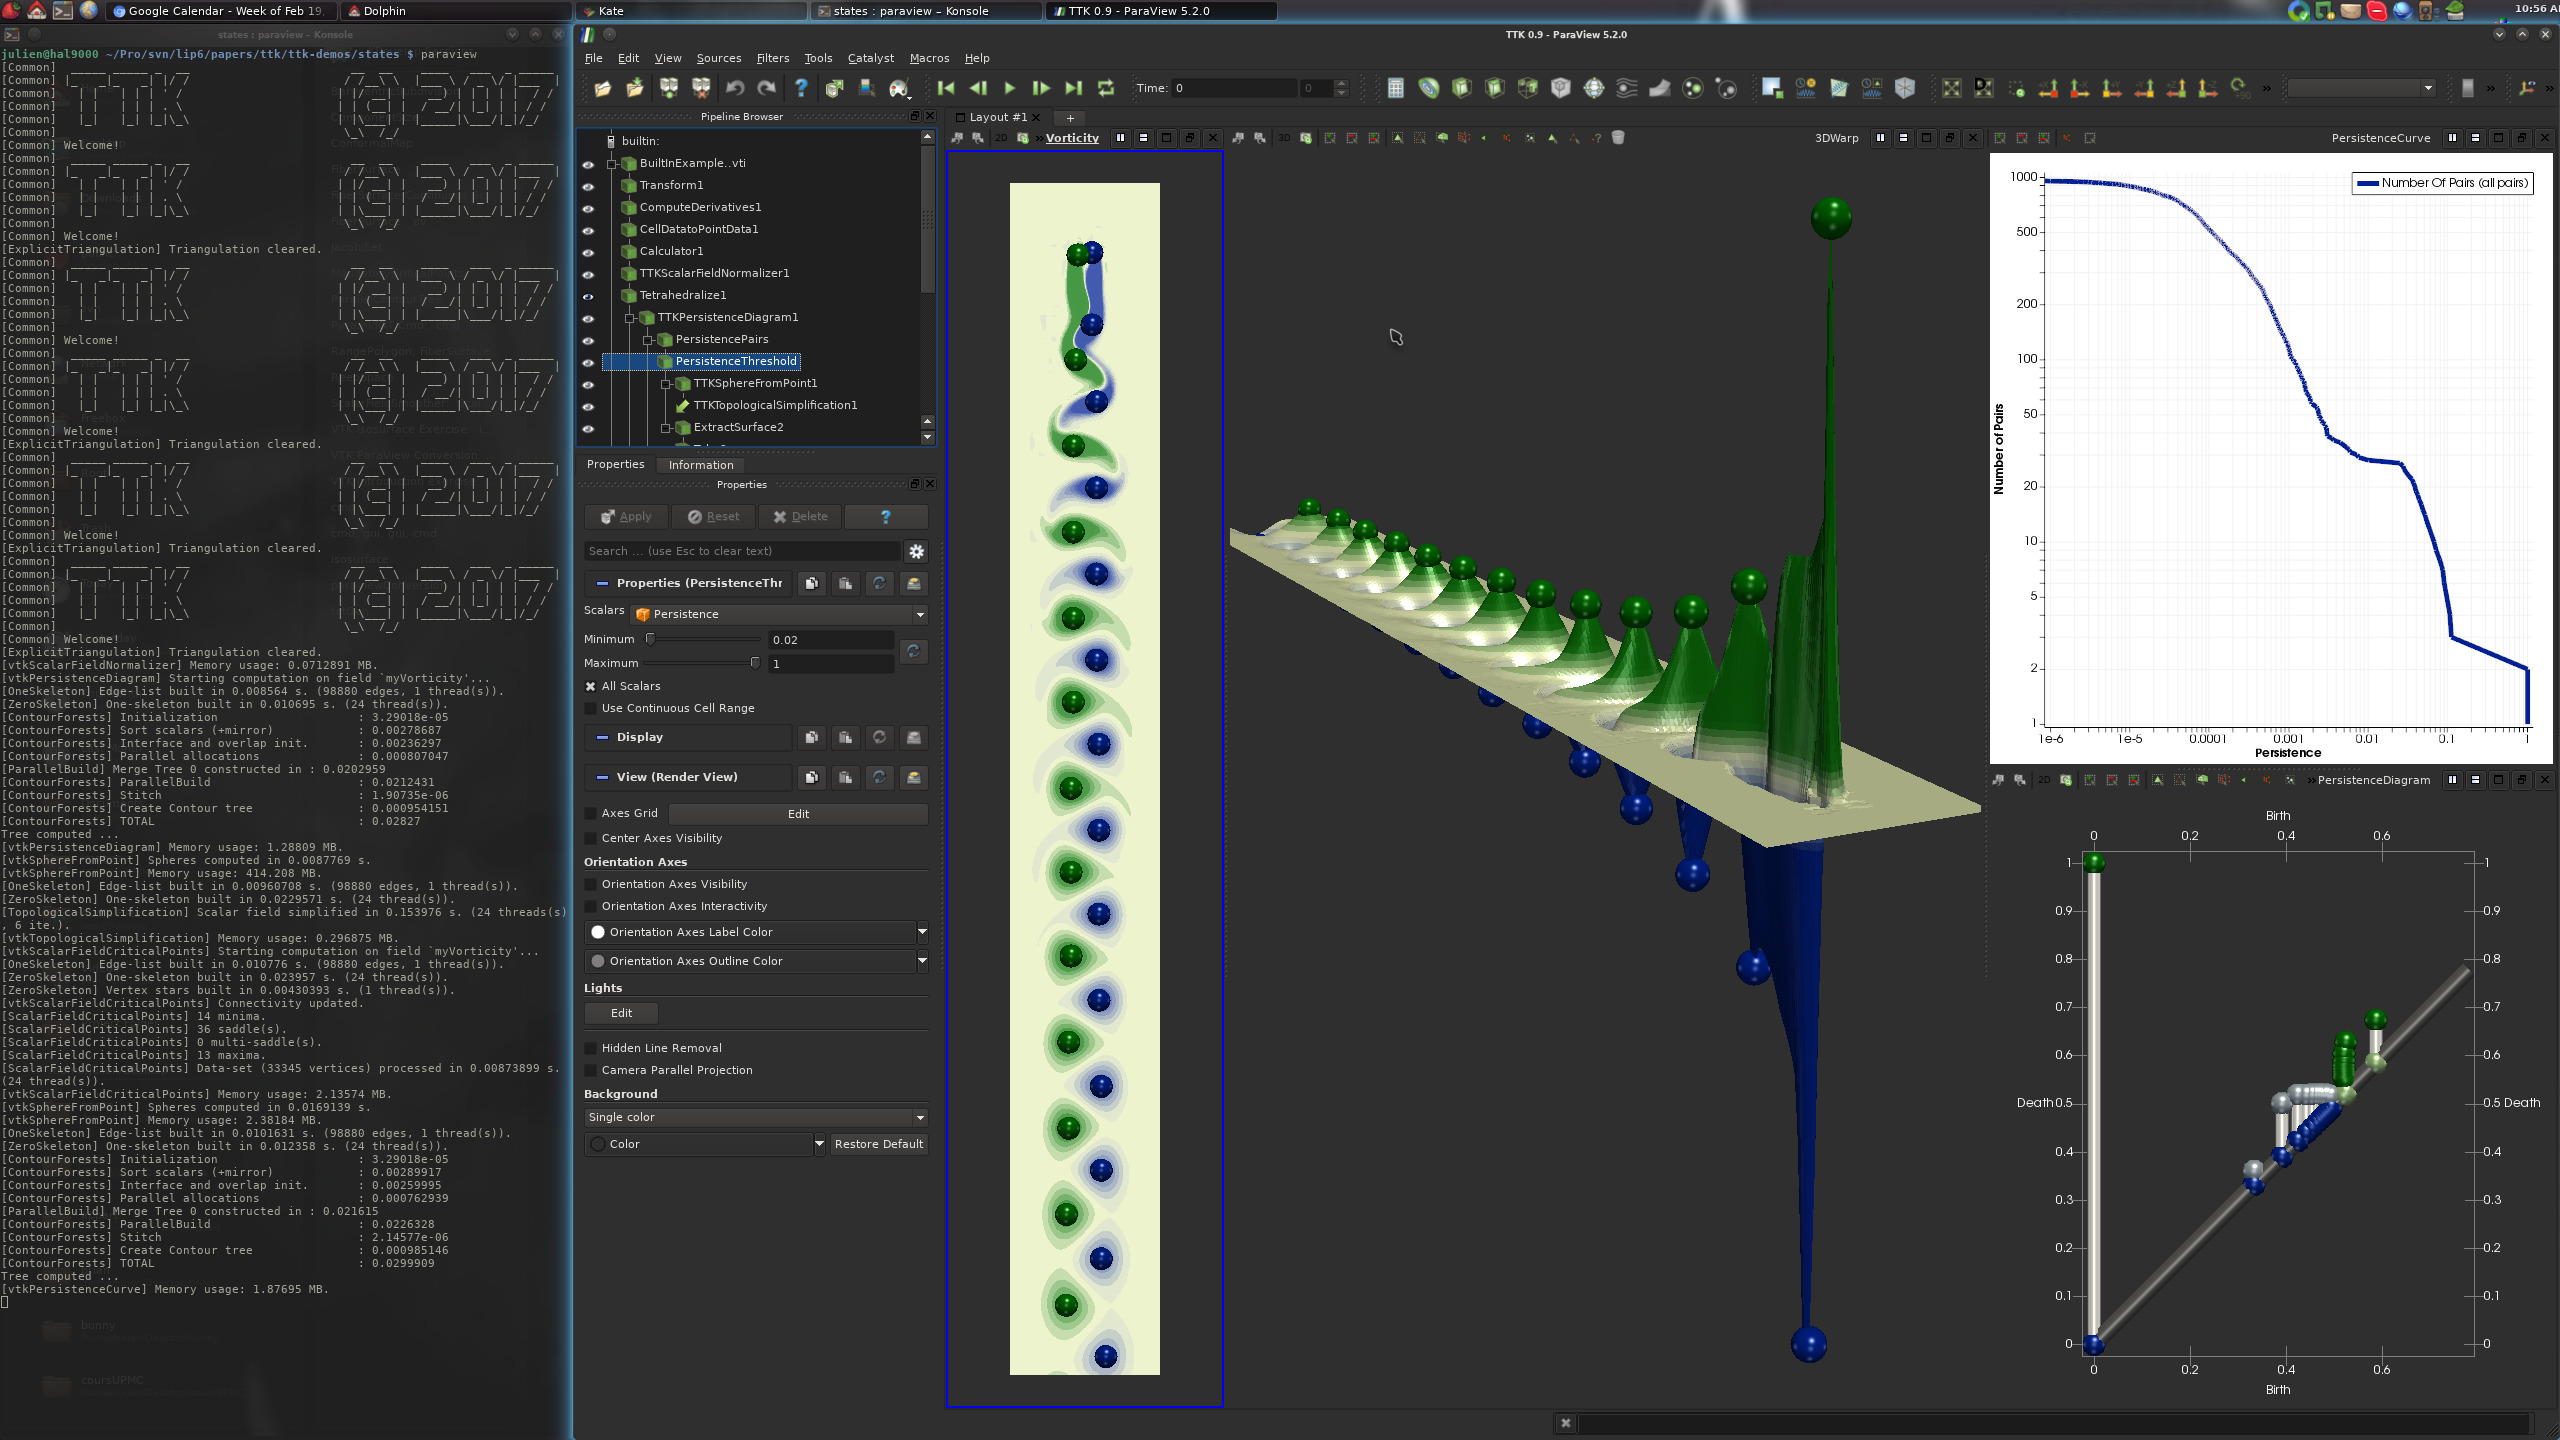
This example computes minima, maxima and the persistence diagram for 2D flow data (von Karman vortex street).
First, the data is transformed and preprocessed to estimate the vorticity of the flow (via the orthogonal component of the curl).
Then, the PersistenceDiagram and PersistenceCurve are computed.
To the persistence diagram, a threshold is applied to remove the diagonal.
The output are the persistence pairs.
These pairs are filtered based on persistence to maintain only the most persistent features.
Next, the input data is simplified based on the selected persistent features, via TopologicalSimplification and the 2D domain is embedded into 3D space based on the scalar values.
Finally, the Critical Points of the simplified and warped data are computed.
ParaView
To reproduce the above screenshot, go to your ttk-data directory and enter the following command:
paraview states/BuiltInExample1.pvsm
Python code
 1
 2
 3
 4
 5
 6
 7
 8
 9
10
11
12
13
14
15
16
17
18
19
20
21
22
23
24
25
26
27
28
29
30
31
32
33
34
35
36
37
38
39
40
41
42
43
44
45
46
47
48
49
50
51
52
53
54
55
56
57
58
59
60
61
62
63
64
65
66
67
68
69
70
71
72
73
74
75
76
77 | #!/usr/bin/env python
from paraview.simple import *
# create a new 'XML Image Data Reader'
builtInExamplevti = XMLImageDataReader(FileName=["BuiltInExample1.vti"])
# create a new 'Transform'
transform1 = Transform(Input=builtInExamplevti)
transform1.Transform = "Transform"
# init the 'Transform' selected for 'Transform'
transform1.Transform.Rotate = [0.0, 0.0, -90.0]
# create a new 'Compute Derivatives'
computeDerivatives1 = ComputeDerivatives(Input=transform1)
# computeDerivatives1.Scalars = [None, '']
computeDerivatives1.Vectors = ["POINTS", "Vectors_"]
computeDerivatives1.OutputVectorType = "Vorticity"
# create a new 'Cell Data to Point Data'
cellDatatoPointData1 = CellDatatoPointData(Input=computeDerivatives1)
# create a new 'Calculator'
calculator1 = Calculator(Input=cellDatatoPointData1)
calculator1.ResultArrayName = "myVorticity"
calculator1.Function = "Vorticity_Z"
# create a new 'TTK ScalarFieldNormalizer'
tTKScalarFieldNormalizer1 = TTKScalarFieldNormalizer(Input=calculator1)
tTKScalarFieldNormalizer1.ScalarField = ["POINTS", "myVorticity"]
# create a new 'Tetrahedralize'
tetrahedralize1 = Tetrahedralize(Input=tTKScalarFieldNormalizer1)
# create a new 'TTK PersistenceDiagram'
tTKPersistenceDiagram1 = TTKPersistenceDiagram(Input=tetrahedralize1)
tTKPersistenceDiagram1.ScalarField = ["POINTS", "myVorticity"]
tTKPersistenceDiagram1.IgnoreBoundary = True
# create a new 'Threshold'
persistencePairs = Threshold(Input=tTKPersistenceDiagram1)
persistencePairs.Scalars = ["CELLS", "PairIdentifier"]
persistencePairs.ThresholdMethod = "Between"
persistencePairs.LowerThreshold = -0.1
persistencePairs.UpperThreshold = 999999999
# create a new 'Threshold'
persistenceThreshold = Threshold(Input=persistencePairs)
persistenceThreshold.Scalars = ["CELLS", "Persistence"]
persistenceThreshold.ThresholdMethod = "Between"
persistenceThreshold.LowerThreshold = 0.02
persistenceThreshold.UpperThreshold = 999999999
# create a new 'TTK PersistenceCurve'
tTKPersistenceCurve1 = TTKPersistenceCurve(Input=tTKPersistenceDiagram1)
# create a new 'TTK TopologicalSimplification'
tTKTopologicalSimplification1 = TTKTopologicalSimplification(
Domain=tetrahedralize1, Constraints=persistenceThreshold
)
tTKTopologicalSimplification1.ScalarField = ["POINTS", "myVorticity"]
# create a new 'Warp By Scalar'
warpByScalar1 = WarpByScalar(Input=tTKTopologicalSimplification1)
warpByScalar1.Scalars = ["POINTS", "myVorticity"]
warpByScalar1.ScaleFactor = 300.0
# create a new 'TTK ScalarFieldCriticalPoints'
tTKScalarFieldCriticalPoints1 = TTKScalarFieldCriticalPoints(Input=warpByScalar1)
tTKScalarFieldCriticalPoints1.ScalarField = ["POINTS", "myVorticity"]
# save the output
SaveData("warpedInput.vtu", warpByScalar1)
SaveData("CriticalPoints.csv", tTKScalarFieldCriticalPoints1)
SaveData("PersistenceDiagram.vtu", tTKPersistenceDiagram1)
SaveData("PersistenceCurve.csv", OutputPort(tTKPersistenceCurve1, 3))
|
To run the above Python script, go to your ttk-data directory and enter the following command:
pvpython python/BuiltInExample1.py
- BuiltInExample1.vti: a two-dimensional regular grid encoding flow magnitude of a Kármán vortex street.
Outputs
warpedInput.vtu: the warped and tetrahedralized scalar field in VTK file format (middle view, above screenshot).CriticalPoints.csv: the critical points of the warped scalar field in csv format (middle view, above screenshot).PersistenceCurve.csv: the output persistence curve (top right view, above screenshot).PersistenceDiagram.vtu: the output persistence diagram in VTK file format (bottom right view, above screenshot). You are free to change the vtu file extension to that of any other supported file format (e.g. csv) in the above python script.
C++/Python API
PersistenceCurve
PersistenceDiagram
ScalarFieldCriticalPoints
ScalarFieldSmoother
TopologicalSimplification