TopoMap Teaser
Pipeline description
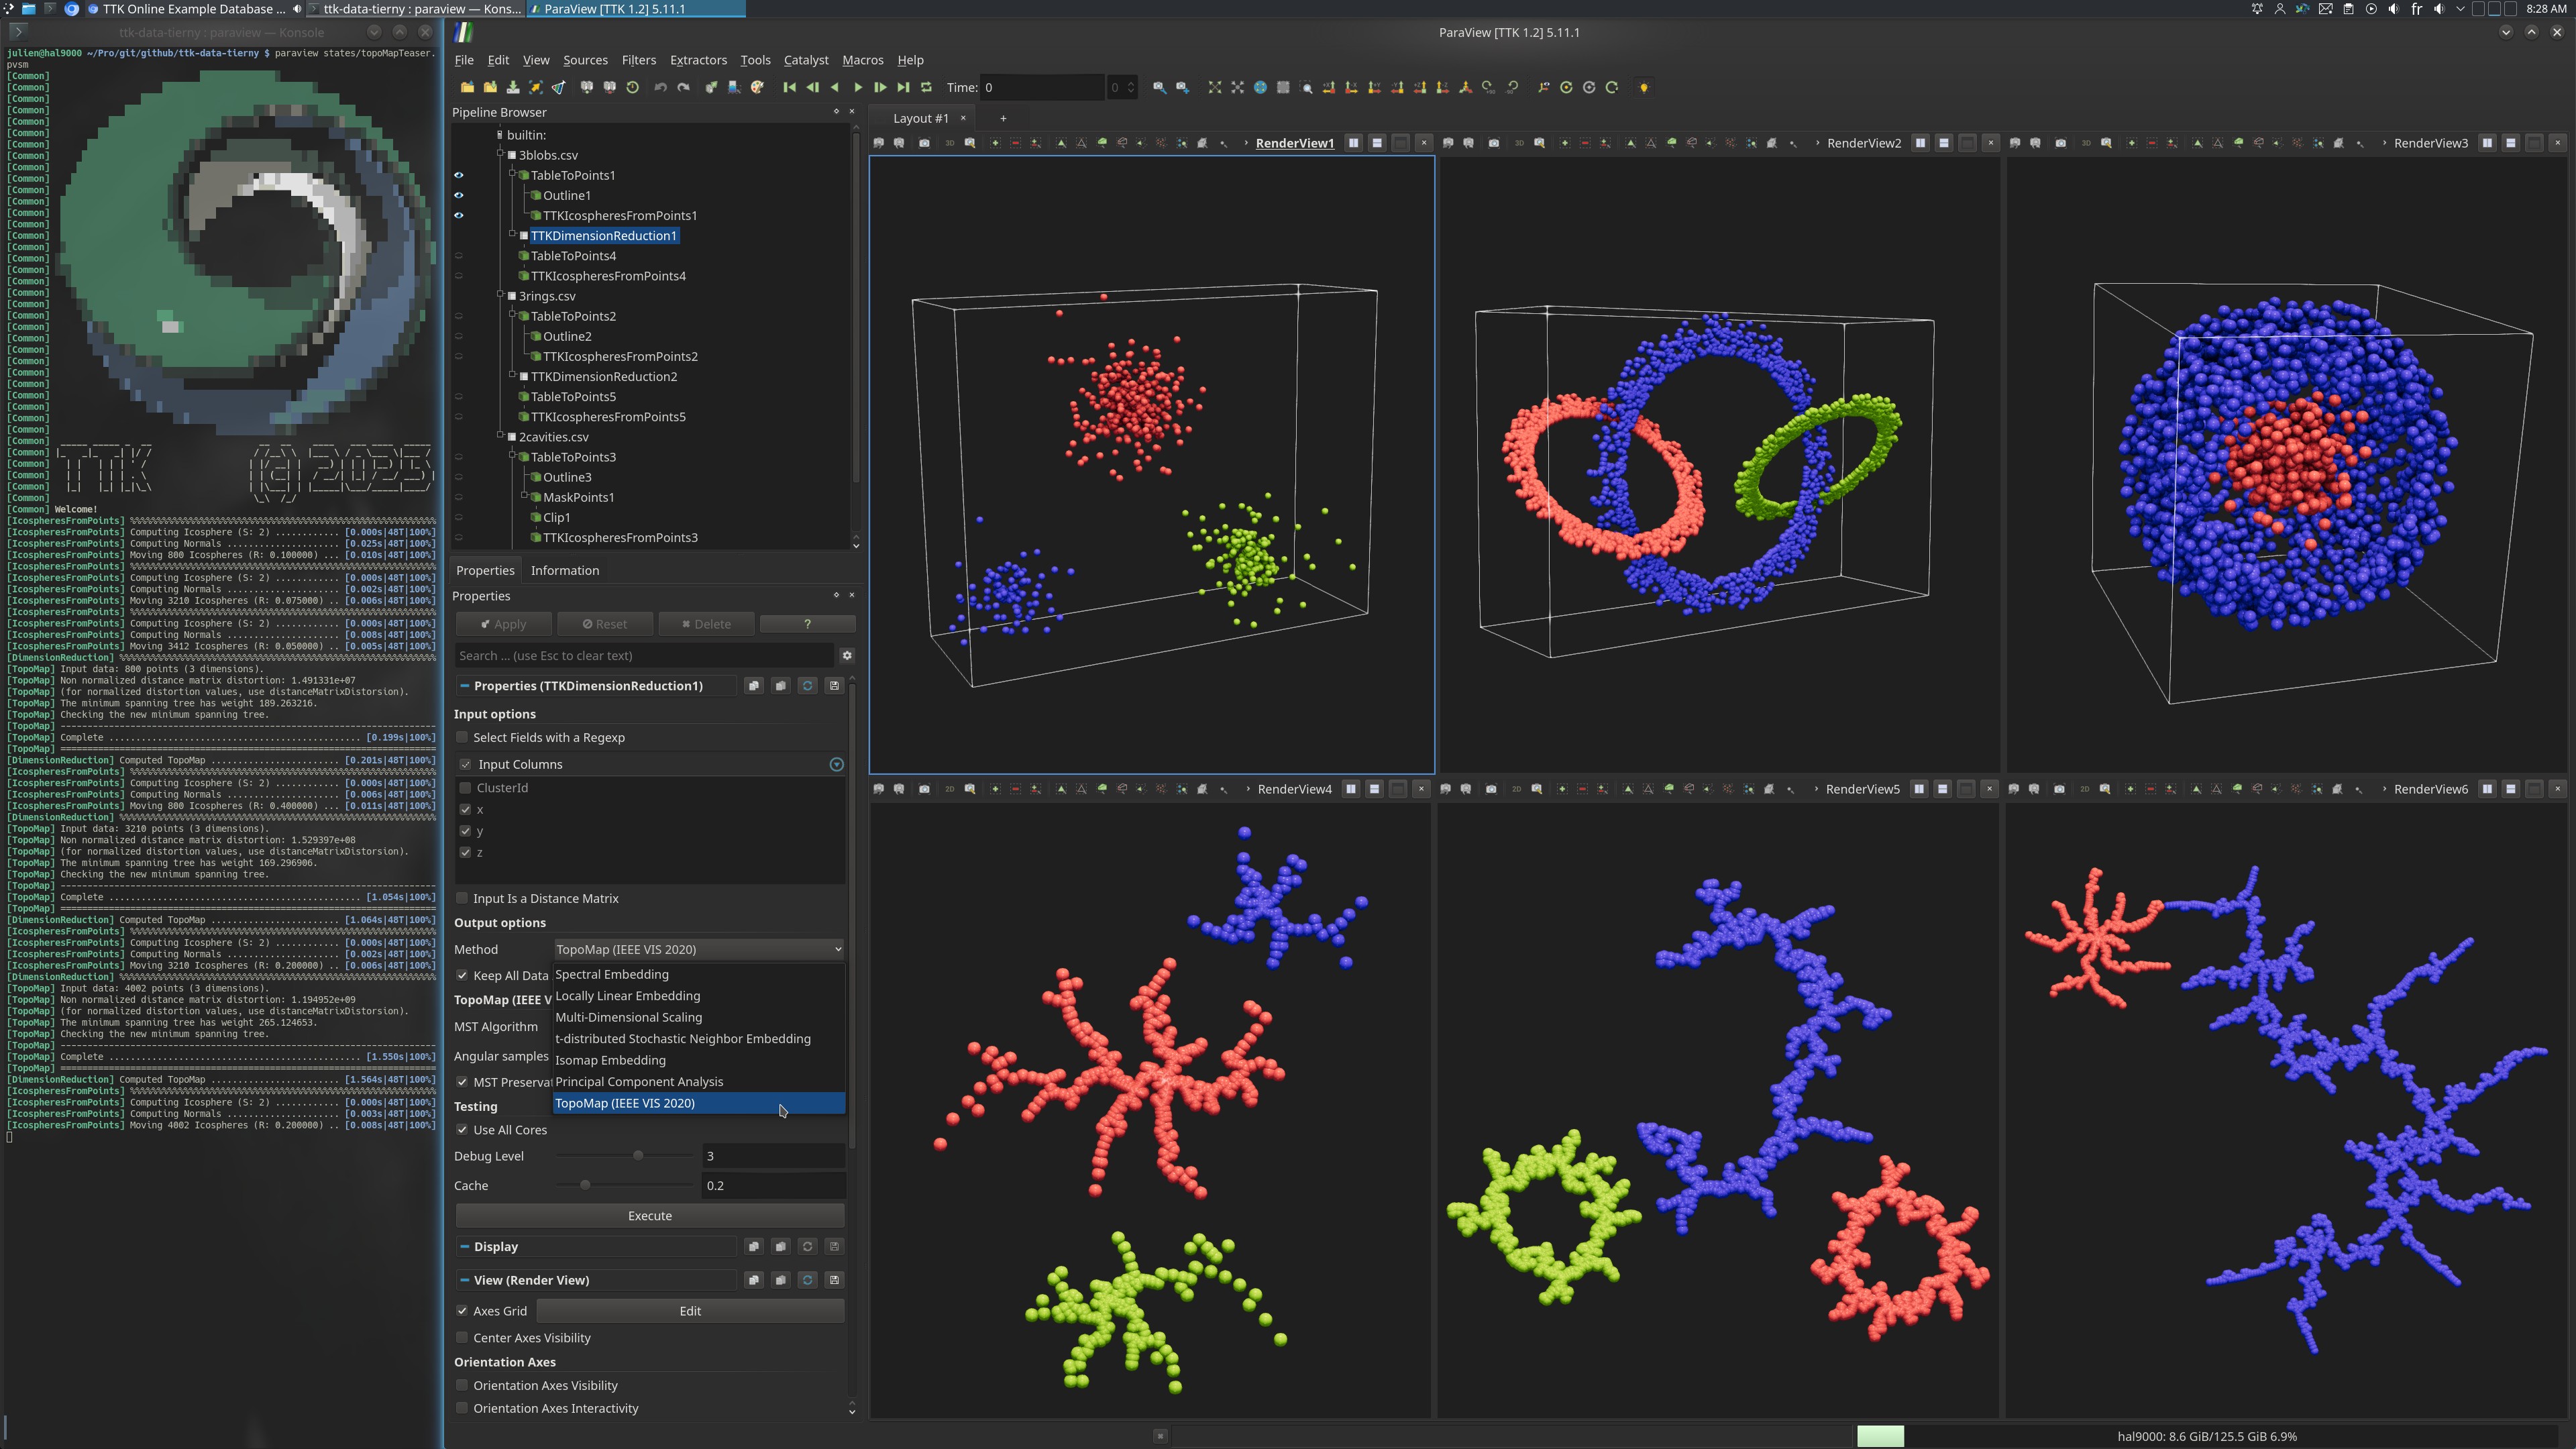
This example illustrates the TopoMap dimensionality reduction technique on a series of toy examples. TopoMap is a projection algorithm (presented at IEEE VIS 2020) which strictly preserves the persistent connected components of the original data, or put differently, its hierarchy of clusters. Intuitively, with TopoMap, you have the guarantee that the "salient" clusters of your high-dimensional data are preserved while projecting it to lower dimensions.
Technically, TopoMap provides the guarantee that the 0-dimensional persistent diagram of the Rips filtration of its output is strictly equal to that of its input. Alternatively, TopoMap guarantees that the hierarchical clustering (with single linkage) of its output is strictly identical to that of its input.
Three toy examples are provided as CSV ASCII files (one line per point, one column per dimension). These are point clouds in 3D, which TopoMap projects down to 2D. Each of these point clouds illustrates a specific topological/geometrical behavior.
The dataset 3blobs.csv contains 3 main clusters (one color per cluster in the above screenshot, top left view), shaped like blobs.
The dataset 3rings.csv contains 3 main clusters (one color per cluster in the above screenshot, top center view), shaped as interleaved rings.
The dataset 2cavities.csv contains 2 main clusters (one color per cluster in the above screenshot, top right view), one (in red) completely enclosed by the other (in blue).
For each of these datasets, TopoMap computes a 2D projection (corresponding bottom views in the above screenshot), which separates well the ground truth clusters (shown with colors).
ParaView
To reproduce the above screenshot, go to your ttk-data directory and enter the following command:
paraview states/topoMapTeaser.pvsm
Python code
1 2 3 4 5 6 7 8 9 10 11 12 13 14 15 16 17 18 19 20 21 | |
To run the above Python script, go to your ttk-data directory and enter the following command:
pvpython python/topoMapTeaser.py
Inputs
- 3blobs.csv: a 3D point cloud in CSV ASCII format (one line per point, one column per dimension), which exhibits 3 main clusters (in the shape of blobs).
- 3rings.csv: a 3D point cloud in CSV ASCII format (one line per point, one column per dimension), which exhibits 3 main clusters (in the shape of interleaved rings).
- 2cavities.csv: a 3D point cloud in CSV ASCII format (one line per point, one column per dimension), which exhibits 2 main clusters (one completely enclosed by the other one).
Outputs
3blobs_topoMap.csv: the output 2D projection of the 3blobs.csv dataset in CSV ASCII format (one line per point, one column per dimension).3rings_topoMap.csv: the output 2D projection of the 3rings.csv dataset in CSV ASCII form at (one line per point, one column per dimension).2cavities_topoMap.csv: the output 2D projection of the 2cavities.csv dataset in CSV ASCII form at (one line per point, one column per dimension).