Skip to content

Karhunen-Love Digits 64-Dimensions

Karhunen-Love Digits 64-Dimensions screenshot

Pipeline description

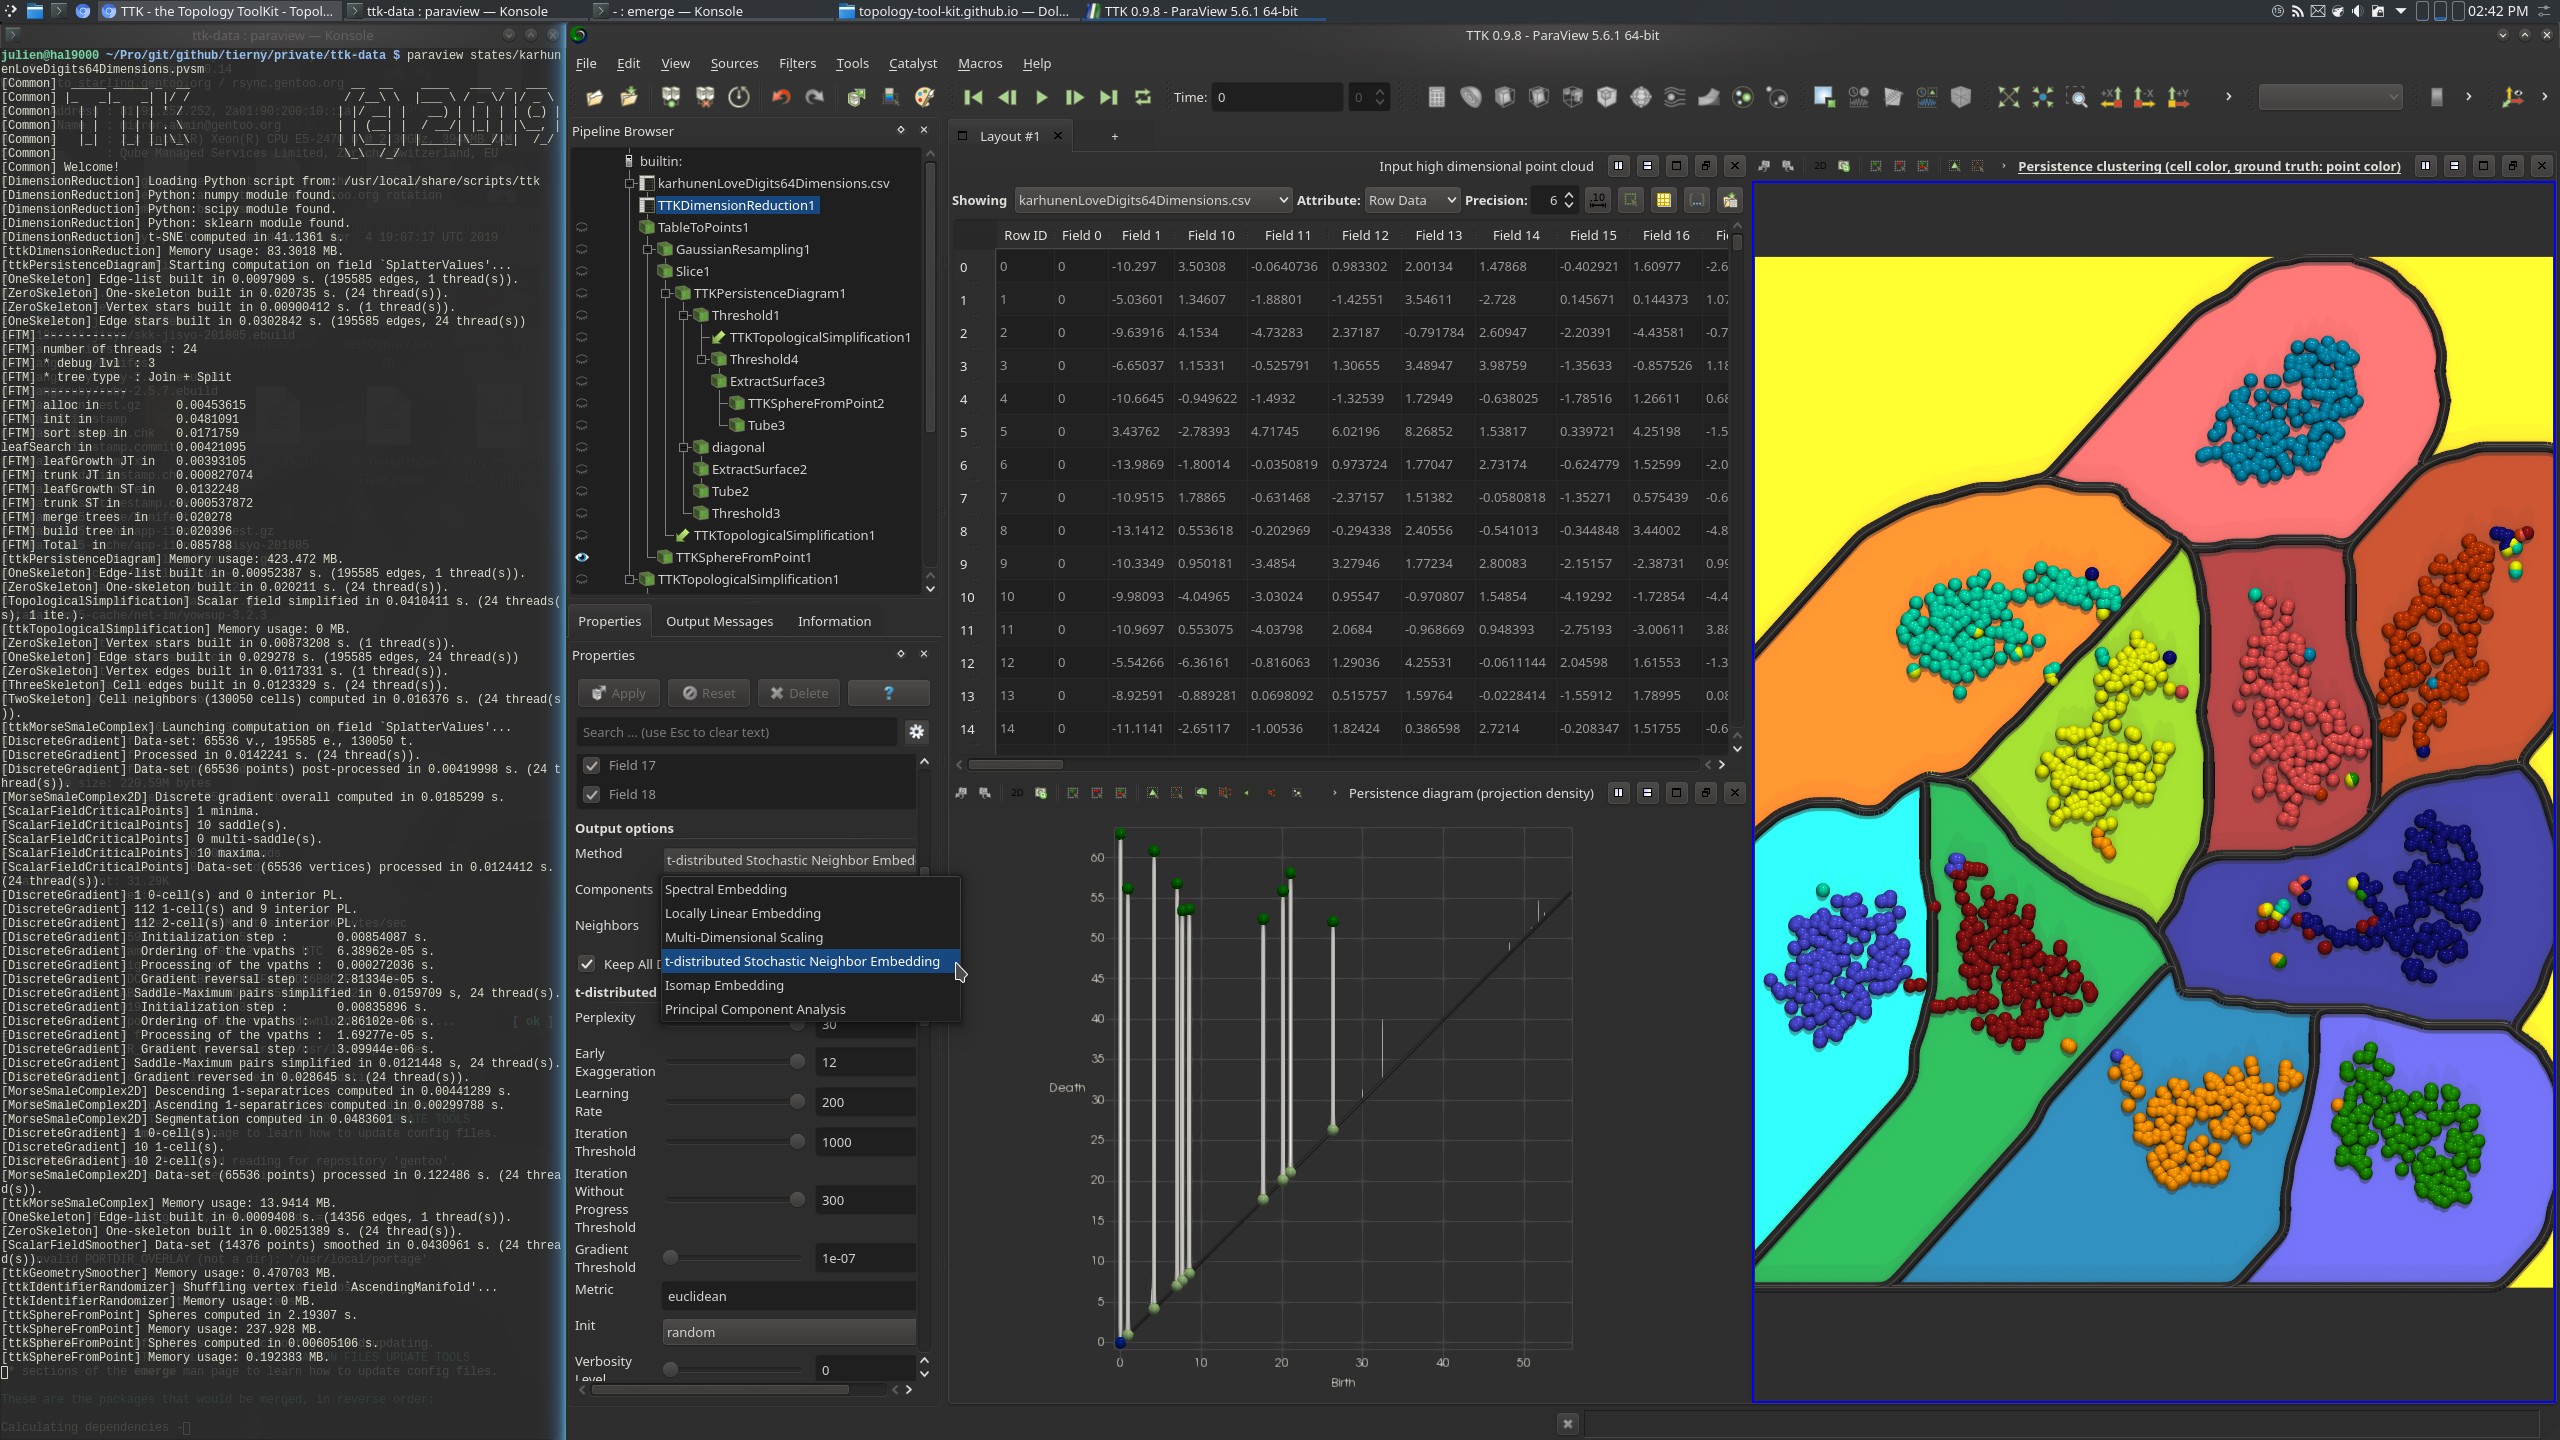
This example performs a persistence driven clustering of a high-dimensional data set, specifically a collection of 2000 images representing hand written digits. Each image is encoded by its Karhunen-Love coefficients, a 64-dimensional vector. This results in a point cloud of 2000 points (2000 rows), living in 64 dimensions (64 columns).

The ground truth classification for each point is provided by the column Field0 (point color in the bottom right view, above screenshot), which indicates the digit represented by the corresponding image.

The pipeline starts by using DimensionReduction (with tSNE) to project the data down to 2D.

Next, the density of the projected 2D point cloud is estimated with a Gaussian kernel, by the GaussianResampling filter, coupled with the Slice filter (to restrict the estimation to a 2D plane).

Next, the PersistenceDiagram of the density field is computed and only the 10 most persistent density maxima are selected (corresponding to the 10 classes, one per digit, bottom left view in the above screenshot).

Next, the simplified persistence diagram is used as a constraint for the TopologicalSimplification of the density field. The simplified density field then contains only 10 maxima and it is used as an input to the Morse-Smale complex computation, for the separation of the 2D space into the output clusters (background color in the bottom right view, above screenshot).

Finally, the cluster identifier of each input point is given by the identifier of the corresponding ascending manifold of the Morse-Smale complex (AscendingManifold), with the ResampleWithDataset filter.

ParaView

To reproduce the above screenshot, go to your ttk-data directory and enter the following command:

paraview states/karhunenLoveDigits64Dimensions.pvsm

Python code

  1
  2
  3
  4
  5
  6
  7
  8
  9
 10
 11
 12
 13
 14
 15
 16
 17
 18
 19
 20
 21
 22
 23
 24
 25
 26
 27
 28
 29
 30
 31
 32
 33
 34
 35
 36
 37
 38
 39
 40
 41
 42
 43
 44
 45
 46
 47
 48
 49
 50
 51
 52
 53
 54
 55
 56
 57
 58
 59
 60
 61
 62
 63
 64
 65
 66
 67
 68
 69
 70
 71
 72
 73
 74
 75
 76
 77
 78
 79
 80
 81
 82
 83
 84
 85
 86
 87
 88
 89
 90
 91
 92
 93
 94
 95
 96
 97
 98
 99
100
101
102
103
104
105
106
107
108
109
110
111
112
113
114
115
116
117
118
119
120
121
122
123
124
125
126
127
128
129
130
131
132
133
134
135
136
#!/usr/bin/env python

from paraview.simple import *

# create a new 'CSV Reader'
karhunenLoveDigits64Dimensionscsv = CSVReader(
    FileName=["karhunenLoveDigits64Dimensions.csv"]
)
karhunenLoveDigits64Dimensionscsv.HaveHeaders = 0

# create a new 'TTK DimensionReduction'
tTKDimensionReduction1 = TTKDimensionReduction(Input=karhunenLoveDigits64Dimensionscsv)
tTKDimensionReduction1.InputColumns = [
    "Field 1",
    "Field 10",
    "Field 11",
    "Field 12",
    "Field 13",
    "Field 14",
    "Field 15",
    "Field 16",
    "Field 17",
    "Field 18",
    "Field 19",
    "Field 2",
    "Field 20",
    "Field 21",
    "Field 22",
    "Field 23",
    "Field 24",
    "Field 25",
    "Field 26",
    "Field 27",
    "Field 28",
    "Field 29",
    "Field 3",
    "Field 30",
    "Field 31",
    "Field 32",
    "Field 33",
    "Field 34",
    "Field 35",
    "Field 36",
    "Field 37",
    "Field 38",
    "Field 39",
    "Field 4",
    "Field 40",
    "Field 41",
    "Field 42",
    "Field 43",
    "Field 44",
    "Field 45",
    "Field 46",
    "Field 47",
    "Field 48",
    "Field 49",
    "Field 5",
    "Field 50",
    "Field 51",
    "Field 52",
    "Field 53",
    "Field 54",
    "Field 55",
    "Field 56",
    "Field 57",
    "Field 58",
    "Field 59",
    "Field 6",
    "Field 60",
    "Field 61",
    "Field 62",
    "Field 63",
    "Field 64",
    "Field 7",
    "Field 8",
    "Field 9",
]
tTKDimensionReduction1.Method = "t-distributed Stochastic Neighbor Embedding"
tTKDimensionReduction1.UseAllCores = False

# create a new 'Table To Points'
tableToPoints1 = TableToPoints(Input=tTKDimensionReduction1)
tableToPoints1.XColumn = "Component_0"
tableToPoints1.YColumn = "Component_1"
tableToPoints1.a2DPoints = 1
tableToPoints1.KeepAllDataArrays = 1

# create a new 'Gaussian Resampling'
gaussianResampling1 = GaussianResampling(Input=tableToPoints1)
gaussianResampling1.ResampleField = ["POINTS", "ignore arrays"]
gaussianResampling1.ResamplingGrid = [256, 256, 3]
gaussianResampling1.SplatAccumulationMode = "Sum"

# create a new 'Slice'
slice1 = Slice(Input=gaussianResampling1)
slice1.SliceType = "Plane"

# init the 'Plane' selected for 'SliceType'
slice1.SliceType.Normal = [0.0, 0.0, 1.0]

# create a new 'TTK PersistenceDiagram'
tTKPersistenceDiagram1 = TTKPersistenceDiagram(Input=slice1)
tTKPersistenceDiagram1.ScalarField = ["POINTS", "SplatterValues"]
tTKPersistenceDiagram1.IgnoreBoundary = False

# create a new 'Threshold'
threshold1 = Threshold(Input=tTKPersistenceDiagram1)
threshold1.Scalars = ["CELLS", "Persistence"]
threshold1.ThresholdMethod = "Between"
threshold1.LowerThreshold = 10.0
threshold1.UpperThreshold = 999999999

# create a new 'TTK TopologicalSimplification'
tTKTopologicalSimplification1 = TTKTopologicalSimplification(
    Domain=slice1, Constraints=threshold1
)
tTKTopologicalSimplification1.ScalarField = ["POINTS", "SplatterValues"]

# create a new 'TTK MorseSmaleComplex'
tTKMorseSmaleComplex1 = TTKMorseSmaleComplex(Input=tTKTopologicalSimplification1)
tTKMorseSmaleComplex1.ScalarField = ["POINTS", "SplatterValues"]

# create a new 'TTK IdentifierRandomizer'
tTKIdentifierRandomizer1 = TTKIdentifierRandomizer(
    Input=OutputPort(tTKMorseSmaleComplex1, 3)
)
tTKIdentifierRandomizer1.ScalarField = ["POINTS", "AscendingManifold"]

# create a new 'Resample With Dataset'
resampleWithDataset1 = ResampleWithDataset(
    SourceDataArrays=tTKIdentifierRandomizer1, DestinationMesh=tableToPoints1
)
resampleWithDataset1.PassPointArrays = 1

SaveData("OutputClustering.csv", resampleWithDataset1)

To run the above Python script, go to your ttk-data directory and enter the following command:

pvpython python/karhunenLoveDigits64Dimensions.py

Inputs

Outputs

  • OutputClustering.csv: the output clustering of the input point cloud (output cluster identifier: AscendingManifold column, ground truth: Field0)

C++/Python API

DimensionReduction

IdentifierRandomizer

Morse-Smale complex

PersistenceDiagram

TopologicalSimplification