Persistence Diagram Clustering
Pipeline description
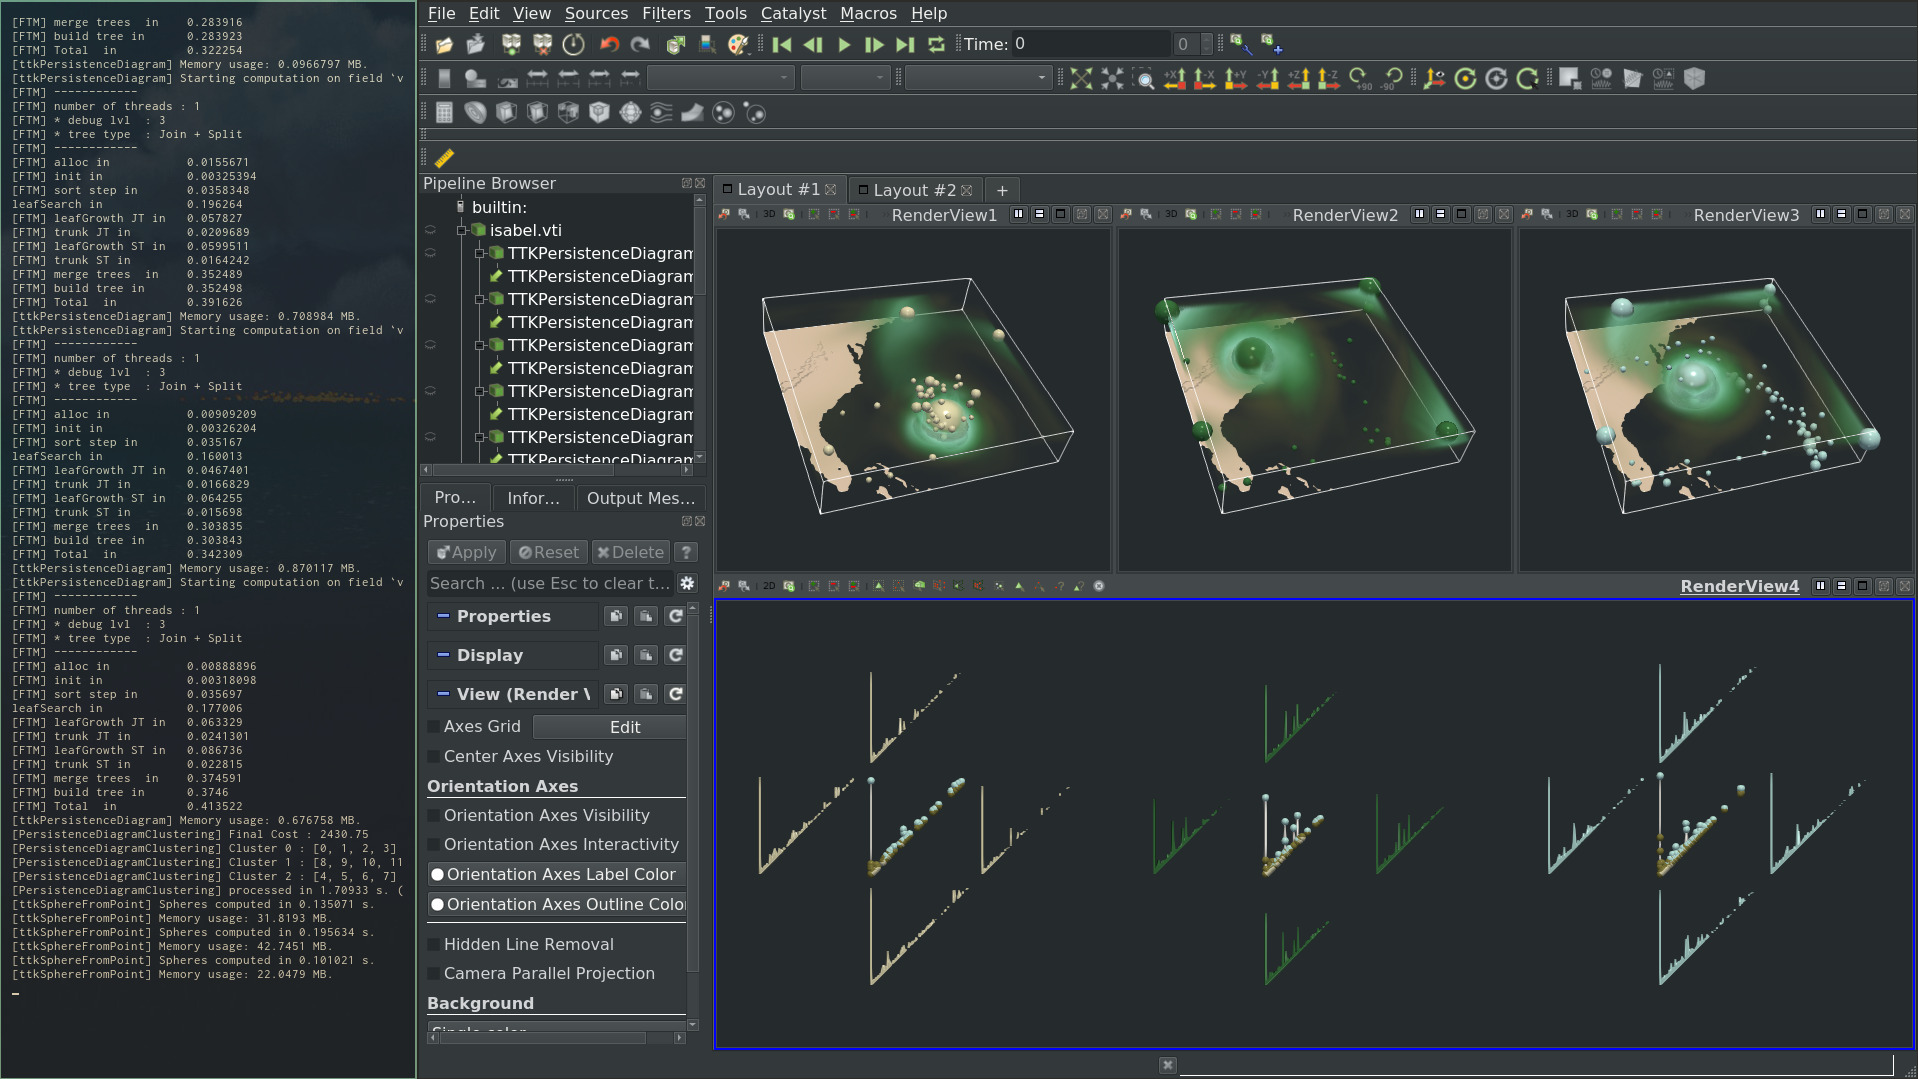
This example first loads an ensemble of scalar fields inside a cinema database from disk. Then, the PersistenceDiagram is computed on each scalar field.
All these diagrams are passed to PersistenceDiagramClustering to compute a clustering in the space of persistence diagrams. The clustering is done using a progressive algorithm. In particular, a time constraint can be set to the approach. The algorithm delivers an partial but meaningful result within this constraint, prioritizing high-persistence pairs in the computation. Each centroid is also an explicit persistence diagram. Upon convergence, it is a Wasserstein barycenter of the diagrams within each cluster. As such, it is representative of the repartition of topological features within each cluster.
In the ParaView state, the extrema corresponding to each centroids are represented in the original 3d domain, scaled by topological persistence.
The python script computes the clustering and saves the related classification in a .csv file. Additionally, the resulting diagram centroids are saved as a multiblock dataset.
ParaView
To reproduce the above screenshot, go to your ttk-data directory and enter the following command:
paraview states/persistenceDiagramClustering.pvsm
Python code
1 2 3 4 5 6 7 8 9 10 11 12 13 14 15 16 17 18 19 20 21 22 23 24 25 26 27 28 29 30 31 32 33 34 35 36 37 38 39 40 41 42 43 44 45 | |
To run the above Python script, go to your ttk-data directory and enter the following command:
pvpython python/persistenceDiagramClustering.py
Inputs
- Isabel.cdb: a cinema database containing 12 scalarfields defined on a regular grid, corresponding to 12 timesteps of a hurricane simulation.
Outputs
PersistenceDiagramClustering_clustering.csv: the output classification.PersistenceDiagramClustering_centroids.vtm: the output centroids.