Tectonic Puzzle
Pipeline description
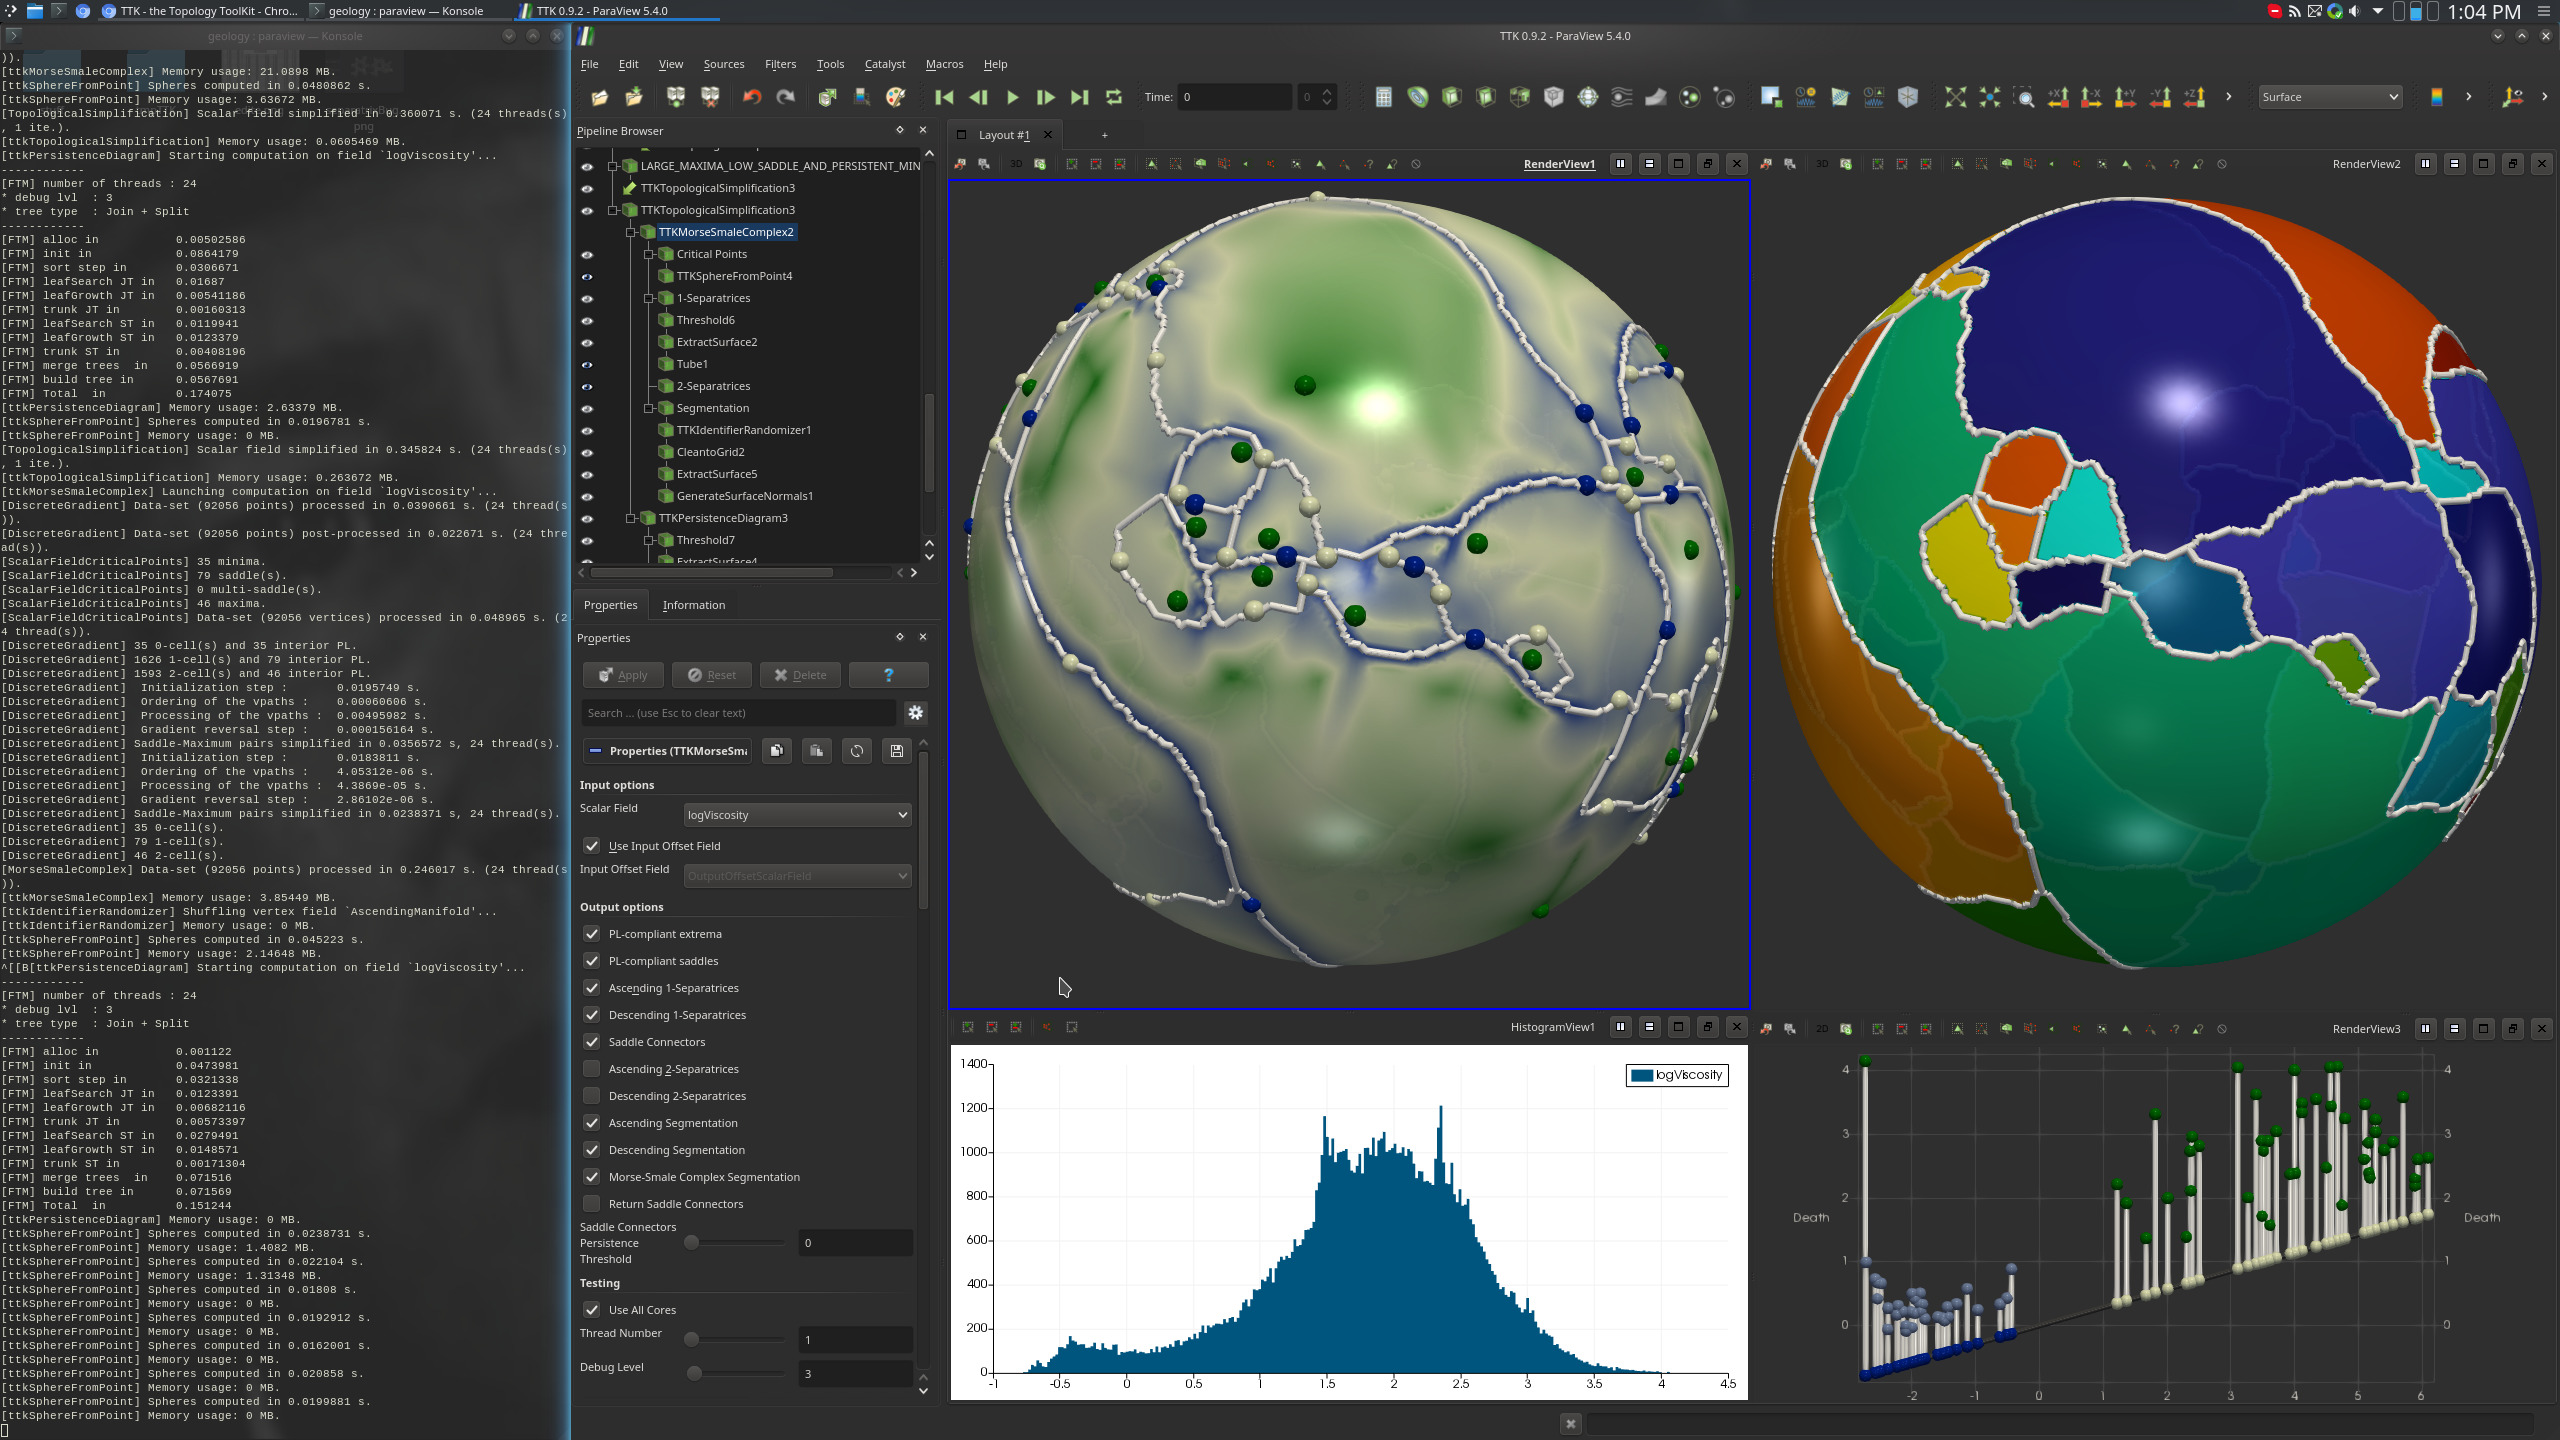
This example processes a two-dimensional geophysics model of the Earth
surface to segment it according to the tectonic plates.
The outer surface of the data-set is first extracted with a
combination of ParaView's Connectivity and Threshold. Then, the
log10 of the Viscosity scalar field is computed with a
Calculator (bottom-right view on the above screenshot).
Several passes of topological simplification are then combined, using
PersistenceDiagram,
TopologicalSimplification
and
MorseSmaleComplex
to further clean the scalar field. The Persistence Diagram of the
scalar field at the end of this cleaning step is represented in the
bottom-right view on the above screenshot.
Once this is done, since the low values of the scalar field represent the
plates borders and the regions of high values the plates themselves,
the Descending 1-Separatrices of the Morse-Smale Complex follow the
plates borders and the AscendingManifold Segmentation of the
Morse-Smale Complex gives us the expected segmentation of the tectonic
plates (top-right view on the above screenshot).
Finally, the
IdentifierRandomizer
filter is used to color neighbor cells with a distinct color (top
right view on the above screenshot).
ParaView
To reproduce the above screenshot, go to your
ttk-data directory
and enter the following command:
paraview states/tectonicPuzzle.pvsm
Python code
  1
  2
  3
  4
  5
  6
  7
  8
  9
 10
 11
 12
 13
 14
 15
 16
 17
 18
 19
 20
 21
 22
 23
 24
 25
 26
 27
 28
 29
 30
 31
 32
 33
 34
 35
 36
 37
 38
 39
 40
 41
 42
 43
 44
 45
 46
 47
 48
 49
 50
 51
 52
 53
 54
 55
 56
 57
 58
 59
 60
 61
 62
 63
 64
 65
 66
 67
 68
 69
 70
 71
 72
 73
 74
 75
 76
 77
 78
 79
 80
 81
 82
 83
 84
 85
 86
 87
 88
 89
 90
 91
 92
 93
 94
 95
 96
 97
 98
 99
100
101
102
103
104
105
106
107
108
109
110
111
112
113
114
115
116
117
118
119
120
121
122
123
124
125
126
127
128
129
130
131
132
133
134
135
136
137
138
139
140
141
142
143
144
145
146
147
148
149
150
151
152
153
154
155
156
157
158
159
160 | #!/usr/bin/env python
from paraview.simple import *
# create a new 'XML Unstructured Grid Reader'
tectonicPuzzlevtu = XMLUnstructuredGridReader(FileName=["tectonicPuzzle.vtu"])
# create a new 'Extract Surface'
extractSurface1 = ExtractSurface(Input=tectonicPuzzlevtu)
# create a new 'Clean to Grid'
cleantoGrid1 = CleantoGrid(Input=extractSurface1)
# create a new 'Tetrahedralize'
tetrahedralize1 = Tetrahedralize(Input=cleantoGrid1)
# create a new 'Connectivity'
connectivity1 = Connectivity(Input=tetrahedralize1)
# create a new 'Threshold'
threshold1 = Threshold(Input=connectivity1)
threshold1.Scalars = ["POINTS", "RegionId"]
threshold1.ThresholdMethod = "Between"
threshold1.LowerThreshold = 1.0
threshold1.UpperThreshold = 1.0
# create a new 'Calculator'
calculator1 = Calculator(Input=threshold1)
calculator1.ResultArrayName = "logViscosity"
calculator1.Function = "log10(Viscosity)"
# create a new 'TTK PersistenceDiagram'
tTKPersistenceDiagram1 = TTKPersistenceDiagram(Input=calculator1)
tTKPersistenceDiagram1.ScalarField = ["POINTS", "logViscosity"]
# create a new 'Threshold'
threshold2 = Threshold(Input=tTKPersistenceDiagram1)
threshold2.Scalars = ["CELLS", "PairIdentifier"]
threshold2.ThresholdMethod = "Between"
threshold2.LowerThreshold = -0.1
threshold2.UpperThreshold = 999999999
# create a new 'Threshold'
persistenceThreshold = Threshold(Input=threshold2)
persistenceThreshold.Scalars = ["CELLS", "Persistence"]
persistenceThreshold.ThresholdMethod = "Between"
persistenceThreshold.LowerThreshold = 0.5
persistenceThreshold.UpperThreshold = 999999999
# create a new 'TTK IcospheresFromPoints'
tTKIcospheresFromPoints1 = TTKIcospheresFromPoints(Input=persistenceThreshold)
tTKIcospheresFromPoints1.Radius = 0.5
# create a new 'TTK TopologicalSimplification'
tTKTopologicalSimplification1 = TTKTopologicalSimplification(
Domain=calculator1, Constraints=persistenceThreshold
)
tTKTopologicalSimplification1.ScalarField = ["POINTS", "logViscosity"]
# create a new 'TTK MorseSmaleComplex'
tTKMorseSmaleComplex1 = TTKMorseSmaleComplex(Input=tTKTopologicalSimplification1)
tTKMorseSmaleComplex1.ScalarField = ["POINTS", "logViscosity"]
# create a new 'TTK IcospheresFromPoints'
tTKIcospheresFromPoints2 = TTKIcospheresFromPoints(Input=tTKMorseSmaleComplex1)
tTKIcospheresFromPoints2.Radius = 0.1
# create a new 'Threshold'
threshold3 = Threshold(Input=tTKIcospheresFromPoints2)
threshold3.Scalars = ["POINTS", "CellDimension"]
threshold3.ThresholdMethod = "Between"
threshold3.LowerThreshold = 2.0
threshold3.UpperThreshold = 2.0
# create a new 'Threshold'
lARGE_MAXIMA_THRESHOLD = Threshold(Input=threshold3)
lARGE_MAXIMA_THRESHOLD.Scalars = ["POINTS", "ManifoldSize"]
lARGE_MAXIMA_THRESHOLD.ThresholdMethod = "Between"
lARGE_MAXIMA_THRESHOLD.LowerThreshold = 75.0
lARGE_MAXIMA_THRESHOLD.UpperThreshold = 999999999
# create a new 'Threshold'
pERSISTENT_MINIMA = Threshold(Input=tTKIcospheresFromPoints1)
pERSISTENT_MINIMA.Scalars = ["POINTS", "CriticalType"]
# create a new 'Append Datasets'
pERSISTENT_MINIMA_AND_LARGE_MAXIMA = AppendDatasets(
Input=[pERSISTENT_MINIMA, lARGE_MAXIMA_THRESHOLD]
)
# create a new 'TTK TopologicalSimplification'
tTKTopologicalSimplification2 = TTKTopologicalSimplification(
Domain=tTKTopologicalSimplification1, Constraints=pERSISTENT_MINIMA_AND_LARGE_MAXIMA
)
tTKTopologicalSimplification2.ScalarField = ["POINTS", "logViscosity"]
# create a new 'TTK PersistenceDiagram'
tTKPersistenceDiagram2 = TTKPersistenceDiagram(Input=tTKTopologicalSimplification2)
tTKPersistenceDiagram2.ScalarField = ["POINTS", "logViscosity"]
# create a new 'Threshold'
threshold4 = Threshold(Input=tTKPersistenceDiagram2)
threshold4.Scalars = ["CELLS", "PairIdentifier"]
threshold4.ThresholdMethod = "Between"
threshold4.LowerThreshold = -0.1
threshold4.UpperThreshold = 999999999
# create a new 'Threshold'
threshold5 = Threshold(Input=threshold4)
threshold5.Scalars = ["CELLS", "PairType"]
threshold5.ThresholdMethod = "Between"
threshold5.LowerThreshold = 1.0
threshold5.UpperThreshold = 1.0
# create a new 'Calculator'
calculator2 = Calculator(Input=threshold5)
calculator2.ResultArrayName = "SaddleValue"
calculator2.Function = "coordsX"
# create a new 'Threshold'
sADDLE_VALUE_THRESHOLD = Threshold(Input=calculator2)
sADDLE_VALUE_THRESHOLD.Scalars = ["POINTS", "SaddleValue"]
sADDLE_VALUE_THRESHOLD.ThresholdMethod = "Between"
sADDLE_VALUE_THRESHOLD.LowerThreshold = -0.2
sADDLE_VALUE_THRESHOLD.UpperThreshold = 1.75
# create a new 'TTK IcospheresFromPoints'
tTKIcospheresFromPoints3 = TTKIcospheresFromPoints(Input=sADDLE_VALUE_THRESHOLD)
tTKIcospheresFromPoints3.Radius = 0.5
# create a new 'Threshold'
lARGE_MAXIMA_LOW_SADDLE = Threshold(Input=tTKIcospheresFromPoints3)
lARGE_MAXIMA_LOW_SADDLE.Scalars = ["POINTS", "CriticalType"]
lARGE_MAXIMA_LOW_SADDLE.ThresholdMethod = "Between"
lARGE_MAXIMA_LOW_SADDLE.LowerThreshold = 3.0
lARGE_MAXIMA_LOW_SADDLE.UpperThreshold = 3.0
# create a new 'Append Datasets'
lARGE_MAXIMA_LOW_SADDLE_AND_PERSISTENT_MINIMA = AppendDatasets(
Input=[pERSISTENT_MINIMA, lARGE_MAXIMA_LOW_SADDLE]
)
# create a new 'TTK TopologicalSimplification'
tTKTopologicalSimplification3 = TTKTopologicalSimplification(
Domain=tTKTopologicalSimplification2,
Constraints=lARGE_MAXIMA_LOW_SADDLE_AND_PERSISTENT_MINIMA,
)
tTKTopologicalSimplification3.ScalarField = ["POINTS", "logViscosity"]
# create a new 'TTK MorseSmaleComplex'
tTKMorseSmaleComplex2 = TTKMorseSmaleComplex(Input=tTKTopologicalSimplification3)
tTKMorseSmaleComplex2.ScalarField = ["POINTS", "logViscosity"]
# create a new 'TTK IdentifierRandomizer'
tTKIdentifierRandomizer1 = TTKIdentifierRandomizer(
Input=OutputPort(tTKMorseSmaleComplex2, 3)
)
tTKIdentifierRandomizer1.ScalarField = ["POINTS", "AscendingManifold"]
SaveData("Segmentation.vtu", tTKIdentifierRandomizer1)
|
To run the above Python script, go to your ttk-data directory and enter the following command:
pvpython python/tectonicPuzzle.py
- tectonicPuzzle.vtu:
two 2-dimensional spheres (one around the other) made up of a
triangular mesh. There are several point data arrays attached to it.
Those scalar fields represent geophysics measures on the earth
surface (and at a certain depth under it); only the
Viscosity
field will be used in the current example.
Outputs
Segmentation.vtu: the output segmentation in VTK file format (top
right view, above screenshot). This corresponds to a segmentation of
the tectonic plates from the Viscosity scalar field.
C++/Python API
IcospheresFromPoints
IdentifierRandomizer
MorseSmaleComplex
PersistenceDiagram
TopologicalSimplification