Harmonic Skeleton
Pipeline description
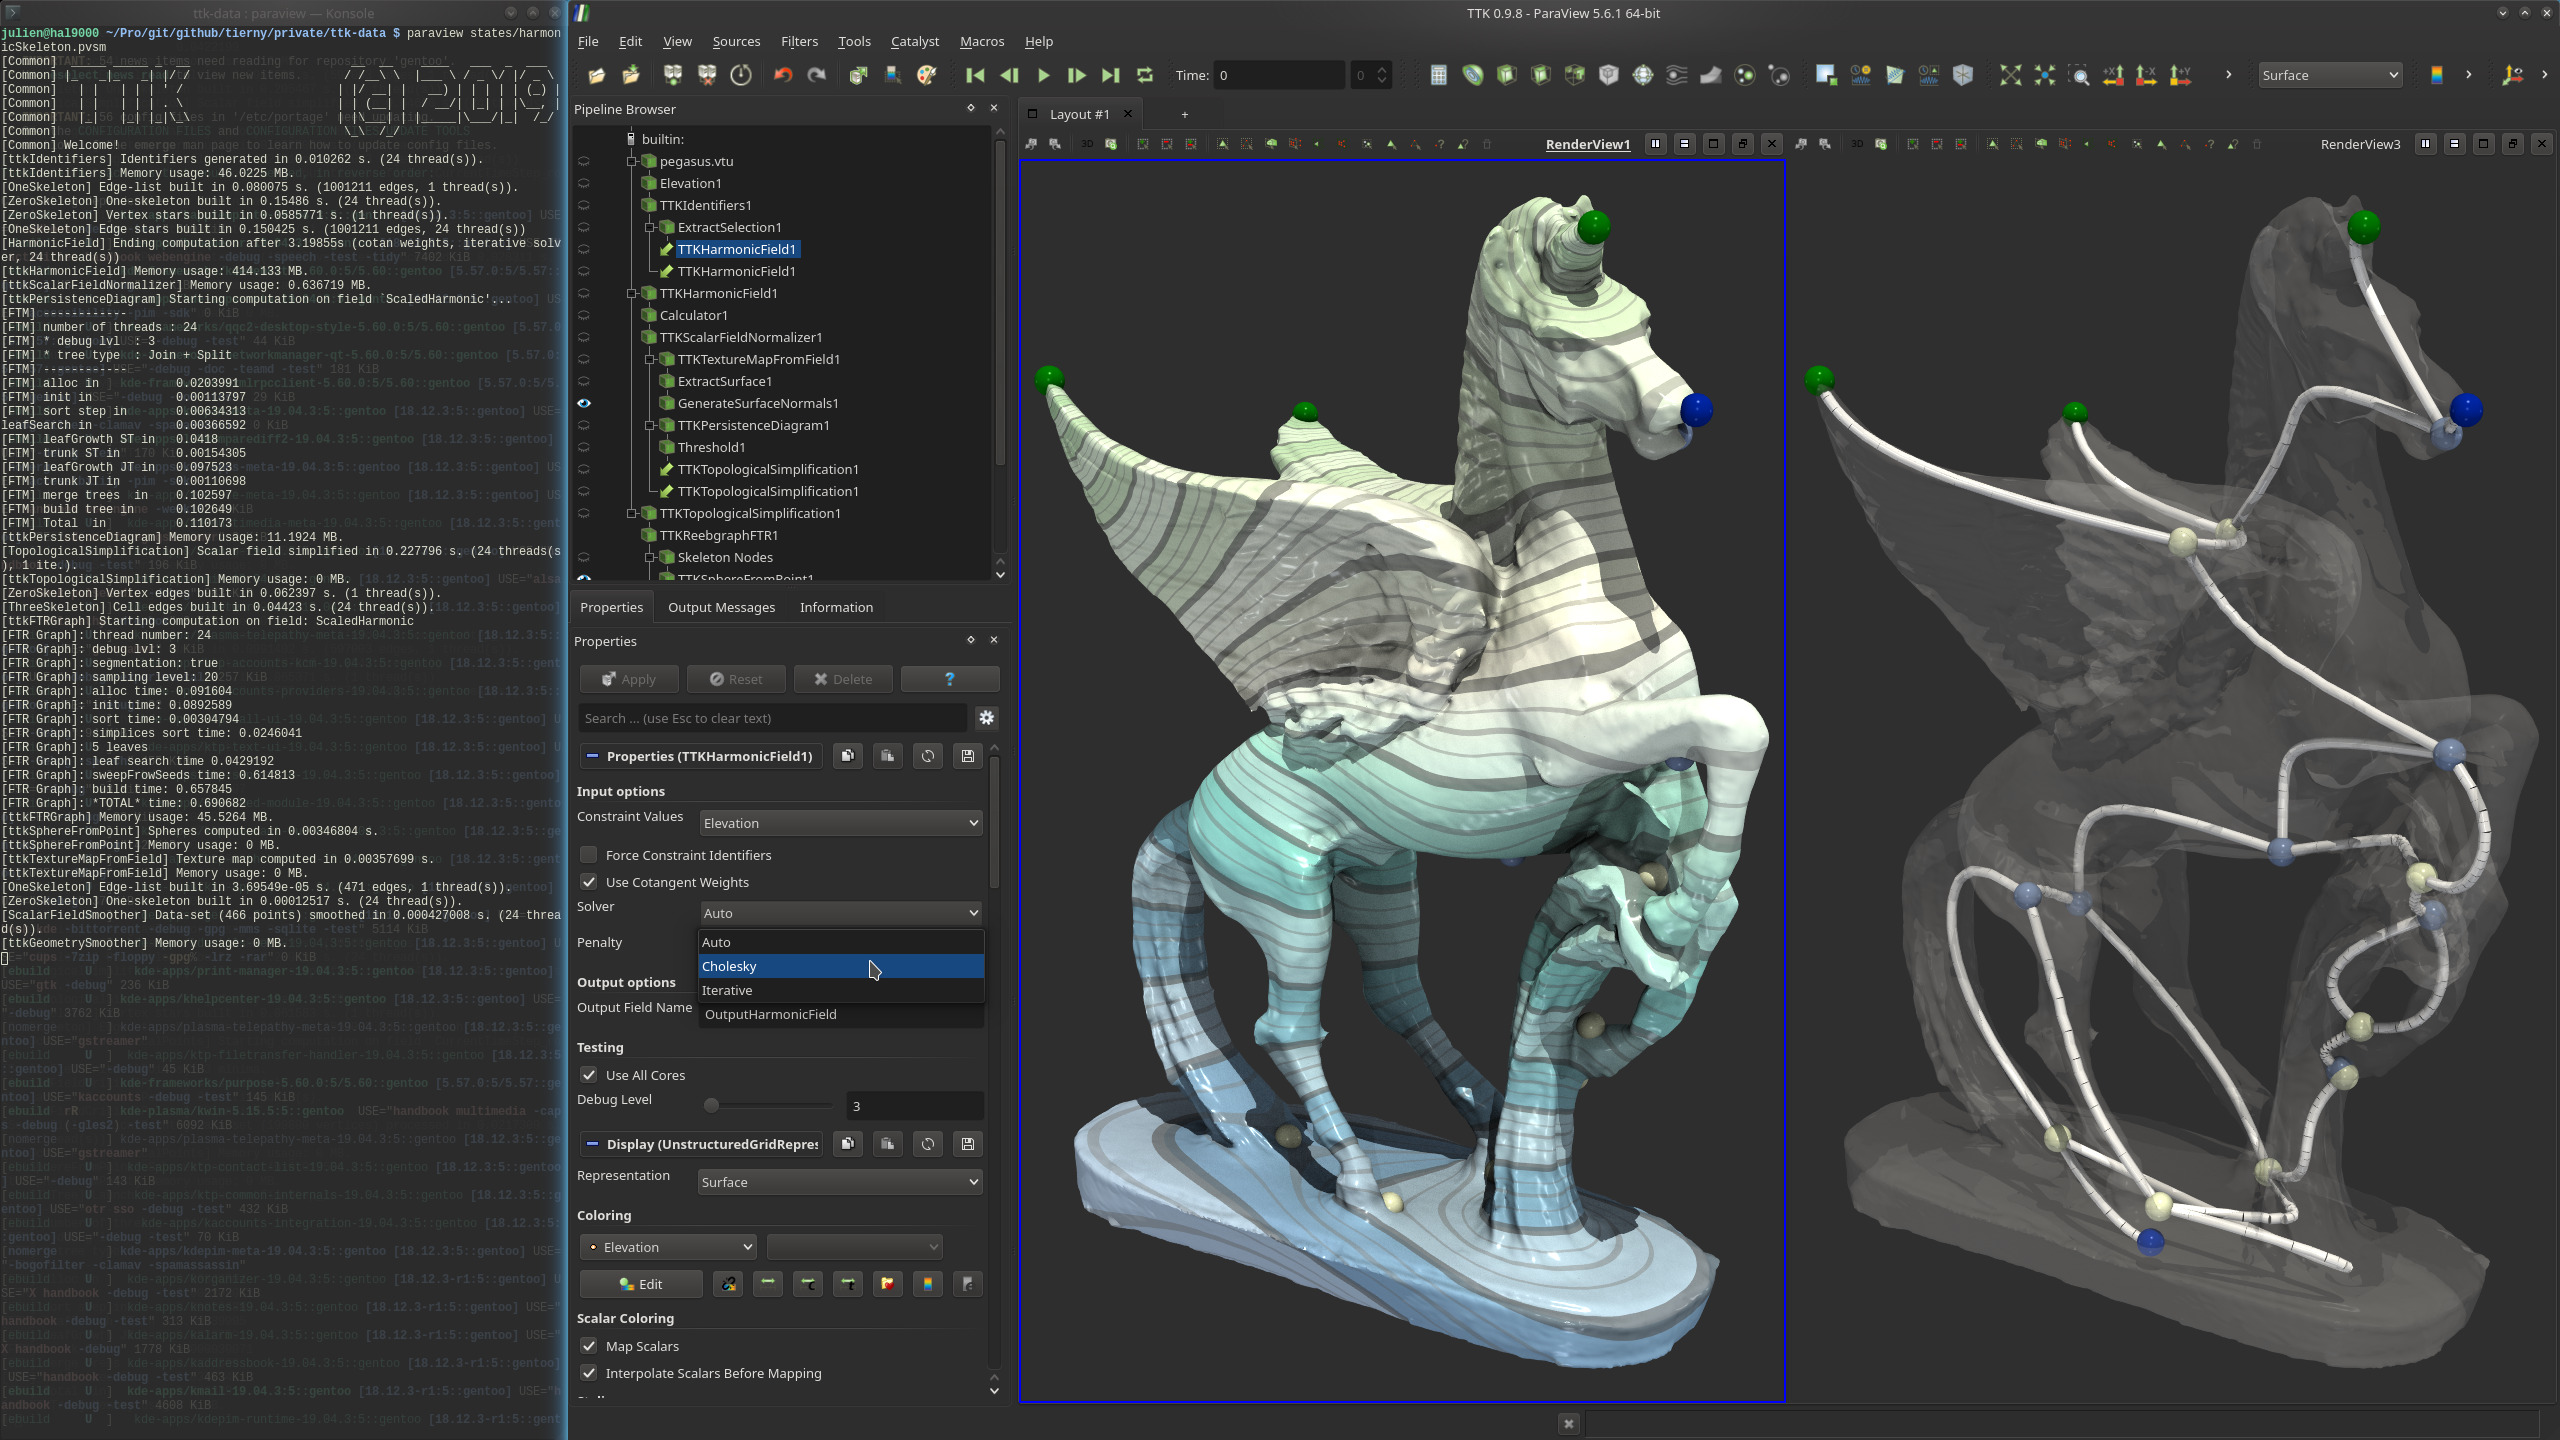
This example first loads the pegasus triangle mesh from disk.
For pre-processing, an elevation function is computed on the mesh, creating Ids for all vertices afterwards.
From the created ids the bottom middle of the platform, both wing tips, the tip of the nose and the tip of the horn of pegasus are selected (right view shows them together with more vertices).
Now, a HarmonicField is computed using these five points as extrema in the output field, helping to reduce noise in the dataset, creating a smooth field with defined extrema that can later be extracted.
The harmonic field is then normalized using the ScalarFieldNormalizer.
Then, the PersistenceDiagram is computed on the normalized field, extracting a threshold that is used to simplify the harmonic field using TopologicalSimplification.
Finally, the ReebGraph is constructed, extracting its nodes and arcs afterwards (right view shows them). The arcs of the ReebGraph are smoothed with the GeometrySmoother to produce the final, output shape skeleton.
ParaView
To reproduce the above screenshot, go to your ttk-data directory and enter the following command:
paraview states/harmonicSkeleton.pvsm
Python code
  1
  2
  3
  4
  5
  6
  7
  8
  9
 10
 11
 12
 13
 14
 15
 16
 17
 18
 19
 20
 21
 22
 23
 24
 25
 26
 27
 28
 29
 30
 31
 32
 33
 34
 35
 36
 37
 38
 39
 40
 41
 42
 43
 44
 45
 46
 47
 48
 49
 50
 51
 52
 53
 54
 55
 56
 57
 58
 59
 60
 61
 62
 63
 64
 65
 66
 67
 68
 69
 70
 71
 72
 73
 74
 75
 76
 77
 78
 79
 80
 81
 82
 83
 84
 85
 86
 87
 88
 89
 90
 91
 92
 93
 94
 95
 96
 97
 98
 99
100
101
102
103
104
105
106
107
108
109
110
111
112
113
114
115
116
117
118
119
120
121
122
123
124
125
126
127
128
129
130
131
132
133
134
135
136
137
138
139
140
141
142
143
144
145
146 | #!/usr/bin/env python
#### import the simple module from the paraview
from paraview.simple import *
# load the pegasus dataset by creating a'XML Unstructured Grid Reader'
pegasusvtu = XMLUnstructuredGridReader(FileName=["pegasus.vtu"])
# create a new 'Elevation' on the dataset
elevation1 = Elevation(Input=pegasusvtu)
elevation1.LowPoint = [55.58376886060912, -88.42696707641238, -1166.7651999539546]
elevation1.HighPoint = [-27.56680371810648, 70.65296514617846, -1072.7592471929715]
# create a new 'Generate Ids'
if GetParaViewVersion() >= (6, 1):
generateIds1 = PointAndCellIds(Input=elevation1)
else:
generateIds1 = GenerateIds(Input=elevation1)
generateIds1.PointIdsArrayName = "ttkVertexScalarField"
# create a new 'Resample With Dataset'
resampleWithDataset1 = ResampleWithDataset(
SourceDataArrays=elevation1, DestinationMesh=generateIds1
)
resampleWithDataset1.PassPointArrays = 1
resampleWithDataset1.CellLocator = "Static Cell Locator"
# create a new 'Extract Selection', creating its query first and clearing it afterwards
Show()
QuerySelect(
QueryString="(ttkVertexScalarField == 29019)",
FieldType="POINT",
InsideOut=0,
Source=resampleWithDataset1,
)
extractSelection1 = ExtractSelection(Input=resampleWithDataset1)
ClearSelection()
# create a new 'Extract Selection', creating its query first and clearing it afterwards
QuerySelect(
QueryString="(ttkVertexScalarField == 171102)",
FieldType="POINT",
InsideOut=0,
Source=resampleWithDataset1,
)
extractSelection2 = ExtractSelection(Input=resampleWithDataset1)
ClearSelection()
# create a new 'Extract Selection', creating its query first and clearing it afterwards
QuerySelect(
QueryString="(ttkVertexScalarField == 204530)",
FieldType="POINT",
InsideOut=0,
Source=resampleWithDataset1,
)
extractSelection3 = ExtractSelection(Input=resampleWithDataset1)
ClearSelection()
# create a new 'Extract Selection', creating its query first and clearing it afterwards
QuerySelect(
QueryString="(ttkVertexScalarField == 216852)",
FieldType="POINT",
InsideOut=0,
Source=resampleWithDataset1,
)
extractSelection4 = ExtractSelection(Input=resampleWithDataset1)
ClearSelection()
# create a new 'Extract Selection', creating its query first and clearing it afterwards
QuerySelect(
QueryString="(ttkVertexScalarField == 219572)",
FieldType="POINT",
InsideOut=0,
Source=resampleWithDataset1,
)
extractSelection5 = ExtractSelection(Input=resampleWithDataset1)
ClearSelection()
# create a new 'Append Datasets'
appendDatasets1 = AppendDatasets(
Input=[
extractSelection1,
extractSelection2,
extractSelection3,
extractSelection4,
extractSelection5,
]
)
# create a new 'TTK HarmonicField'
tTKHarmonicField1 = TTKHarmonicField(
Domain=resampleWithDataset1, Constraints=appendDatasets1
)
tTKHarmonicField1.ScalarField = ["POINTS", "Elevation"]
tTKHarmonicField1.ConstraintVerticesIdentifiers = ["POINTS", "Elevation"]
# create a new 'Calculator'
calculator1 = Calculator(Input=tTKHarmonicField1)
calculator1.ResultArrayName = "ScaledHarmonic"
calculator1.Function = "OutputHarmonicField^2.375"
# create a new 'TTK ScalarFieldNormalizer'
tTKScalarFieldNormalizer1 = TTKScalarFieldNormalizer(Input=calculator1)
tTKScalarFieldNormalizer1.ScalarField = ["POINTS", "ScaledHarmonic"]
# create a new 'TTK PersistenceDiagram'
tTKPersistenceDiagram1 = TTKPersistenceDiagram(Input=tTKScalarFieldNormalizer1)
tTKPersistenceDiagram1.ScalarField = ["POINTS", "ScaledHarmonic"]
tTKPersistenceDiagram1.EmbedinDomain = 1
# create a new 'Threshold'
threshold1 = Threshold(Input=tTKPersistenceDiagram1)
threshold1.Scalars = ["CELLS", "Persistence"]
threshold1.ThresholdMethod = "Between"
threshold1.LowerThreshold = 0.001
threshold1.UpperThreshold = 999999999
# create a new 'TTK TopologicalSimplification'
tTKTopologicalSimplification1 = TTKTopologicalSimplification(
Domain=tTKScalarFieldNormalizer1, Constraints=threshold1
)
tTKTopologicalSimplification1.ScalarField = ["POINTS", "ScaledHarmonic"]
# create a new 'TTK Reeb Graph'
tTKReebgraphFTR1 = TTKReebGraph(Input=tTKTopologicalSimplification1)
tTKReebgraphFTR1.ScalarField = ["POINTS", "ScaledHarmonic"]
tTKReebgraphFTR1.ArcSampling = 20
tTKReebgraphFTR1.UseAllCores = False
# create a new 'TTK GeometrySmoother' taking the reeb graph edges for input
tTKGeometrySmoother1 = TTKGeometrySmoother(Input=OutputPort(tTKReebgraphFTR1, 1))
tTKGeometrySmoother1.IterationNumber = 20
# create a new 'Extract Surface'
extractSurface2 = ExtractSurface(Input=tTKGeometrySmoother1)
# create a new 'Tube' representing the reep graph edges
tube1 = Tube(Input=extractSurface2)
tube1.Radius = 0.75
# create a new 'TTK IcospheresFromPoints' representing the reeb graph nodes
tTKIcospheresFromPoints1 = TTKIcospheresFromPoints(Input=tTKReebgraphFTR1)
tTKIcospheresFromPoints1.Radius = 2.0
SaveData("ReebGraphNodes.vtp", tTKIcospheresFromPoints1)
SaveData("ReebGraphArcs.vtp", tube1)
|
To run the above Python script, go to your ttk-data directory and enter the following command:
pvpython python/harmonicSkeleton.py
Outputs
ReebGraphNodes.vtp: spheres, representing the nodes of the output ReebGraph
in VTK file format (bottom right view, above screenshot). You are free to change the vtp file extension to that of any other supported file format (e.g. csv) in the above python script.ReebGraphArcs.vtp: cylinders (the output skeleton of the input shape), representing the arcs of the output ReebGraph
in VTK file format (bottom right view, above screenshot). You are free to change the vtp file extension to that of any other supported file format (e.g. csv) in the above python script.
C++/Python API
ReebGraph
GeometrySmoother
HarmonicField
IcosphereFromPoints
PersistenceDiagram
ScalarFieldNormalizer
TopologicalSimplification