1-Manifold Learning Circles
Pipeline description
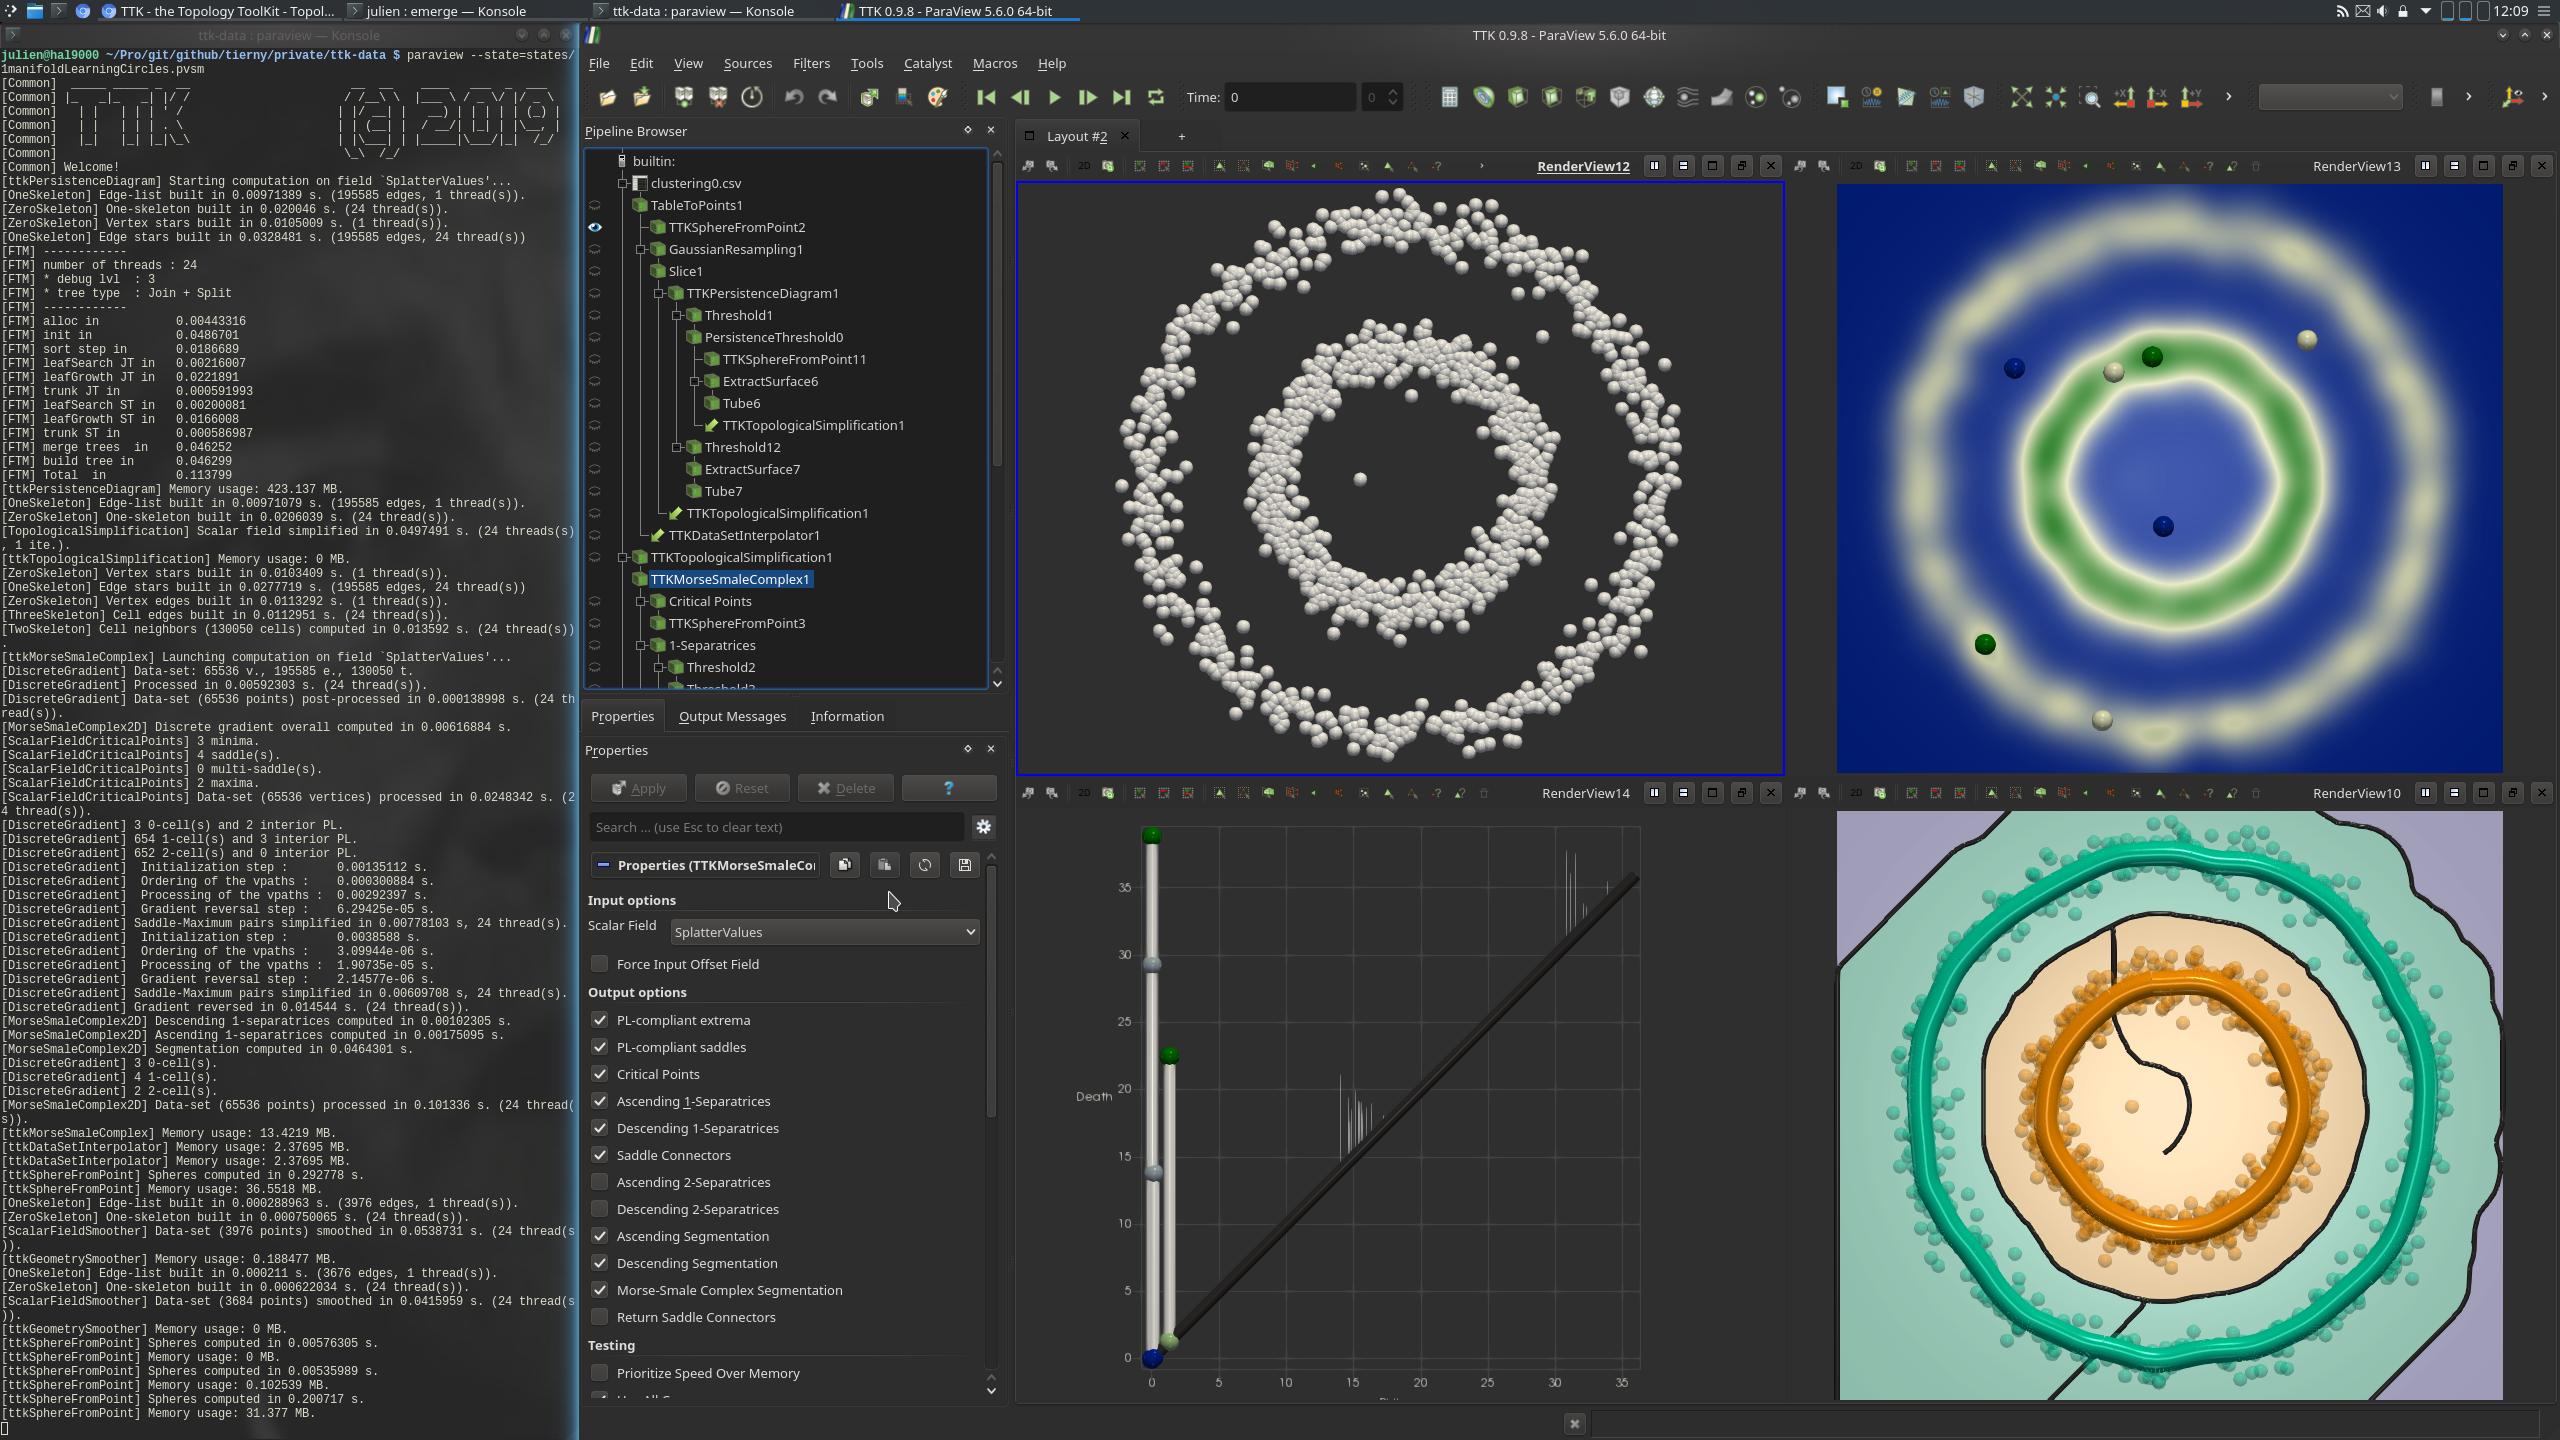
This example first loads a point cloud from disk. The points are arranged in mainly two concentric circles, one bigger than the other.
In a pre-processing, the data is converted to a format understandable by Paraview using the TableToPoints filter (upper left view, above screenshot). GaussianResampling is applied to the data. This filter has the effect of injecting input points to a structured data. For each injection, each point will "splat", or distribute values to nearby vertices. Only a slice of the data is kept (upper right, above screenshot). The resulting SplatterValues field is a density estimation (with a Gaussian kernel) of the point cloud in 2D.
Then, the PersistenceDiagram is computed and thresholds are applied base on persistence to maintain only the most persistent features. This results in a simplified persistence diagram (bottom left view, above screenshot).
The simplified persistence diagram is then used as a constraint for the TopologicalSimplification of the input scalar data.
This simplified data is then used as the input of the computation of MorseSmaleComplex (bottom right view, above screenshot). This complex is composed of elements of 3 dimensions: dimension 0, which corresponds to the critical points of the Morse-Smale Complex, dimension 1, which corresponds to its edges and dimension 2, which corresponds to its surfaces. The generators of the clusters are edges of the Morse-Smale Complex. Not all edges of the Complex are useful: using thresholds, only the separatrices connected to maxima are kept (Separatrix = 1). Then the edges with the field SeparatrixFunctionMinimum below a certain value (here 2) are also discarded. This corresponds to the two green and yellow generators (bottom right view, above screenshot).
ParaView
To reproduce the above screenshot, go to your ttk-data directory and enter the following command:
paraview states/1manifoldLearningCircles.pvsm
Python code
1 2 3 4 5 6 7 8 9 10 11 12 13 14 15 16 17 18 19 20 21 22 23 24 25 26 27 28 29 30 31 32 33 34 35 36 37 38 39 40 41 42 43 44 45 46 47 48 49 50 51 52 53 54 55 56 57 58 59 60 61 62 63 64 65 66 67 68 69 70 71 72 73 74 75 76 77 78 79 | |
To run the above Python script, go to your ttk-data directory and enter the following command:
pvpython python/1manifoldLearningCircles.py
Inputs
-
- clustering0.csv: a table containing 2D point coordinates arranged in concentric circles.
Outputs
Clustering.csv: Resampled dataset to store the clustering (fieldAscendingManifold). You are free to change thevtufile extension to that of any other supported file format (e.g.csv) in the above python script.Generators.vtu: edges (or 1 dimensional elements) of the output Morse Smale Complex after passing through two thresholds in VTK file format (bottom right view, above screenshot). Only the edges connected to maximam with the fieldSeparatrixFunctionMinimumbelow 2 are saved in this file. You are free to change thevtufile extension to that of any other supported file format (e.g.csv) in the above python script.