Persistence Diagram Distance
Pipeline description
This example first loads an ensemble of twelve scalar fields inside a cinema database from disk. Two scalar fields are extracted from the ensemble.
Then, the PersistenceDiagram is computed on both fields.
PersistenceDiagramClustering is then used to compute the Wasserstein distance between the two persistence diagrams.
The assignment problem associated to the distance is computed using the Auction algorithm, and the corresponding matchings are displayed in ParaView.
The actual distance is available in the field data of the 'matchings' output.
The python script computes the distance and prints it in the terminal output. Additionally, it saves the distance as a .csv file.
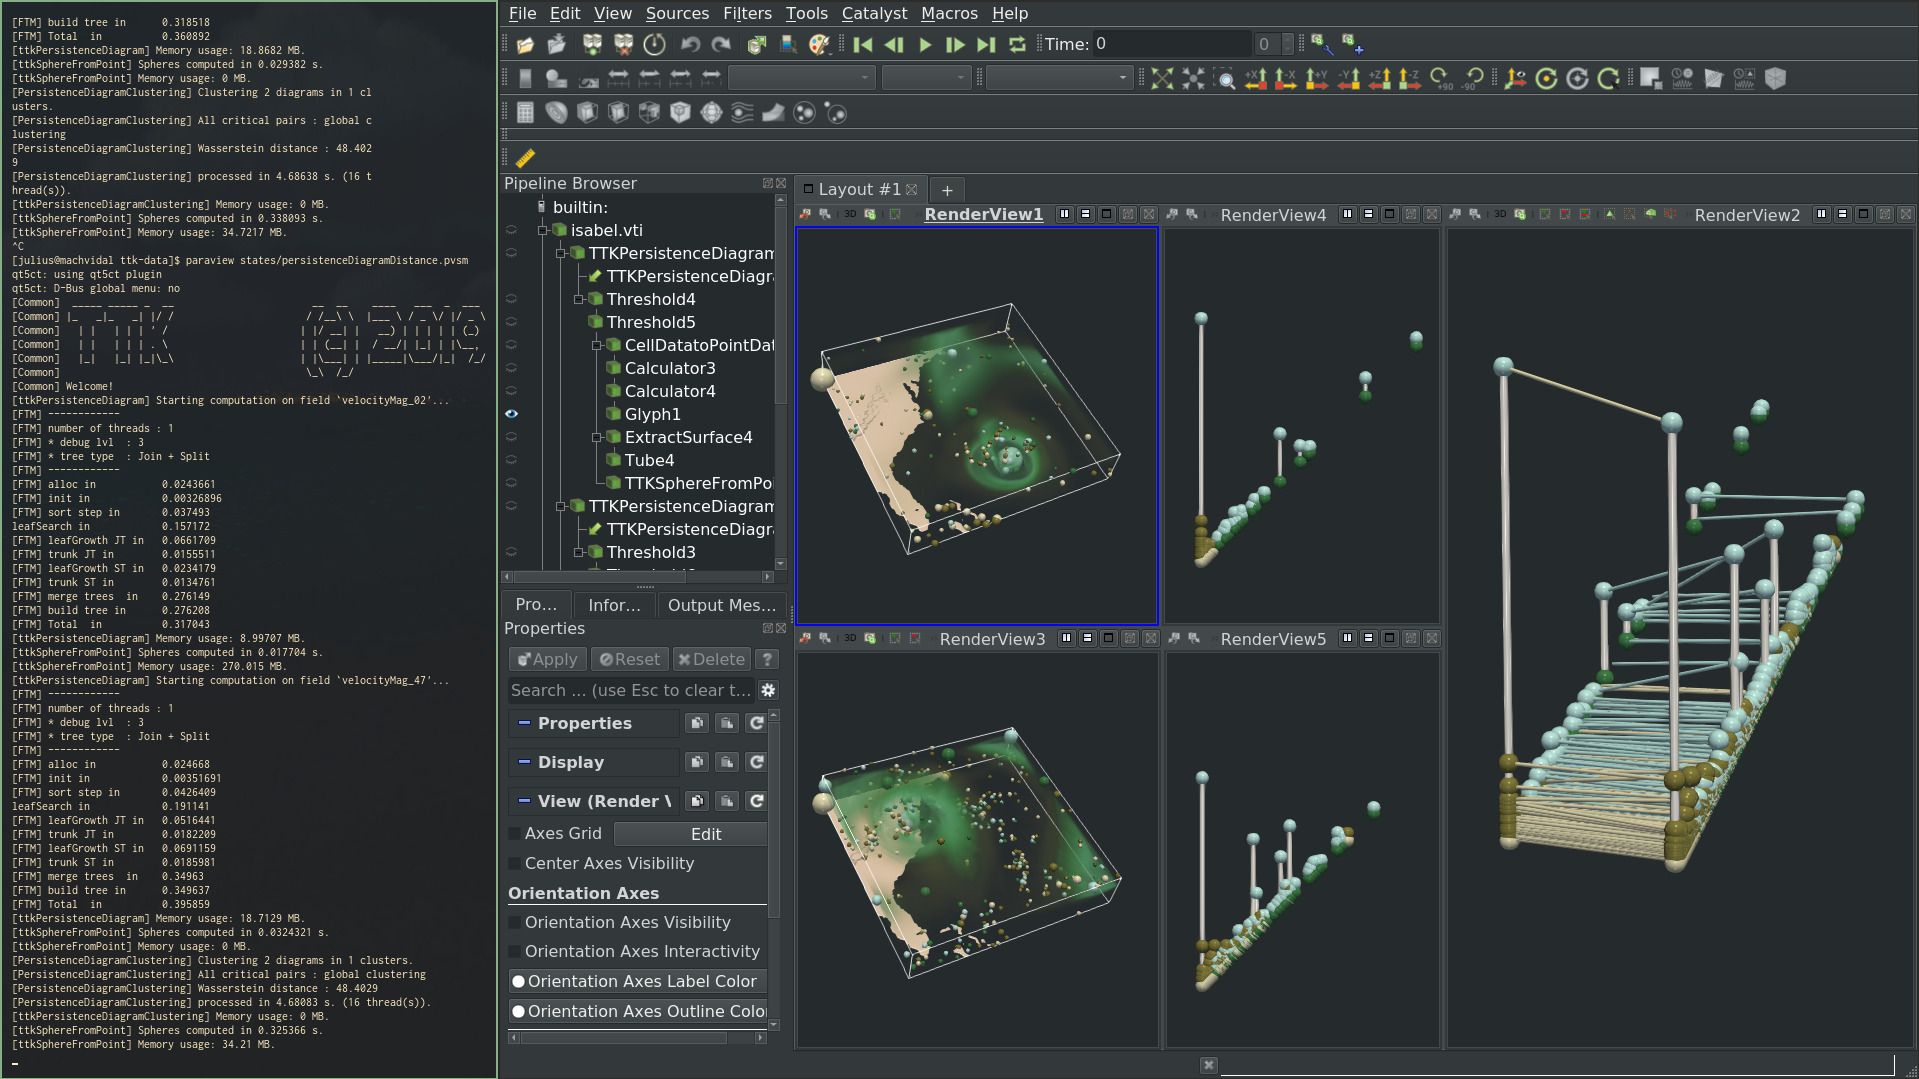
ParaView
To reproduce the above screenshot, go to your ttk-data directory and enter the following command:
paraview states/persistenceDiagramDistance.pvsm
Python code
 1
 2
 3
 4
 5
 6
 7
 8
 9
10
11
12
13
14
15
16
17
18
19
20
21
22
23
24
25
26
27
28
29
30
31
32
33
34
35
36
37
38
39
40
41
42
43
44
45
46
47
48 | #! /usr/bin/env/python
from paraview.simple import *
import numpy as np
# create a new 'TTK CinemaReader'
tTKCinemaReader1 = TTKCinemaReader(DatabasePath="Isabel.cdb")
# create a new 'TTK CinemaProductReader'
tTKCinemaProductReader1 = TTKCinemaProductReader(Input=tTKCinemaReader1)
# create a new 'Extract Block'
extractBlock1 = ExtractBlock(Input=tTKCinemaProductReader1)
extractBlock1.Selectors = ["/Root/Block0", "/Root/Block10"]
# create a new 'Calculator'
calculator1 = Calculator(Input=extractBlock1)
calculator1.ResultArrayName = "velocityMag"
calculator1.Function = "-velocityMag"
# create a new 'TTK PersistenceDiagram'
tTKPersistenceDiagram3 = TTKPersistenceDiagram(Input=calculator1)
tTKPersistenceDiagram3.ScalarField = ["POINTS", "velocityMag"]
tTKPersistenceDiagram3.InputOffsetField = ["POINTS", "velocityMag"]
tTKPersistenceDiagram3.IgnoreBoundary = False
# create a new 'Threshold'
threshold7 = Threshold(Input=tTKPersistenceDiagram3)
threshold7.Scalars = ["CELLS", "Persistence"]
threshold7.LowerThreshold = 1.2
threshold7.UpperThreshold = 136.490955383565
# create a new 'TTK PersistenceDiagramClustering'
tTKPersistenceDiagramClustering1 = TTKPersistenceDiagramClustering(Input=threshold7)
UpdatePipeline()
# Get the data
matchings_data = FetchData(OutputPort(tTKPersistenceDiagramClustering1, 2))[0]
# Get field data
field_data = matchings_data.GetBlock(0).GetFieldData()
# Display the Wasserstein distance
wasserstein_distance = field_data.GetArray("WassersteinDistance").GetValue(0)
# Save the Wasserstein distance in a csv file
np.savetxt("WassersteinDistance.csv", [wasserstein_distance])
|
To run the above Python script, go to your ttk-data directory and enter the following command:
pvpython python/persistenceDiagramDistance.py
- Isabel.cdb: a cinema database containing 12 scalarfields defined on a regular grid, corresponding to 12 timesteps of a hurricane simulation.
Outputs
WassersteinDistance.csv: the output distance between the two persistence diagrams.
C++/Python API
CinemaReader
CinemaProductReader
PersistenceDiagram
PersistenceDiagramClustering