CT bones
Pipeline description
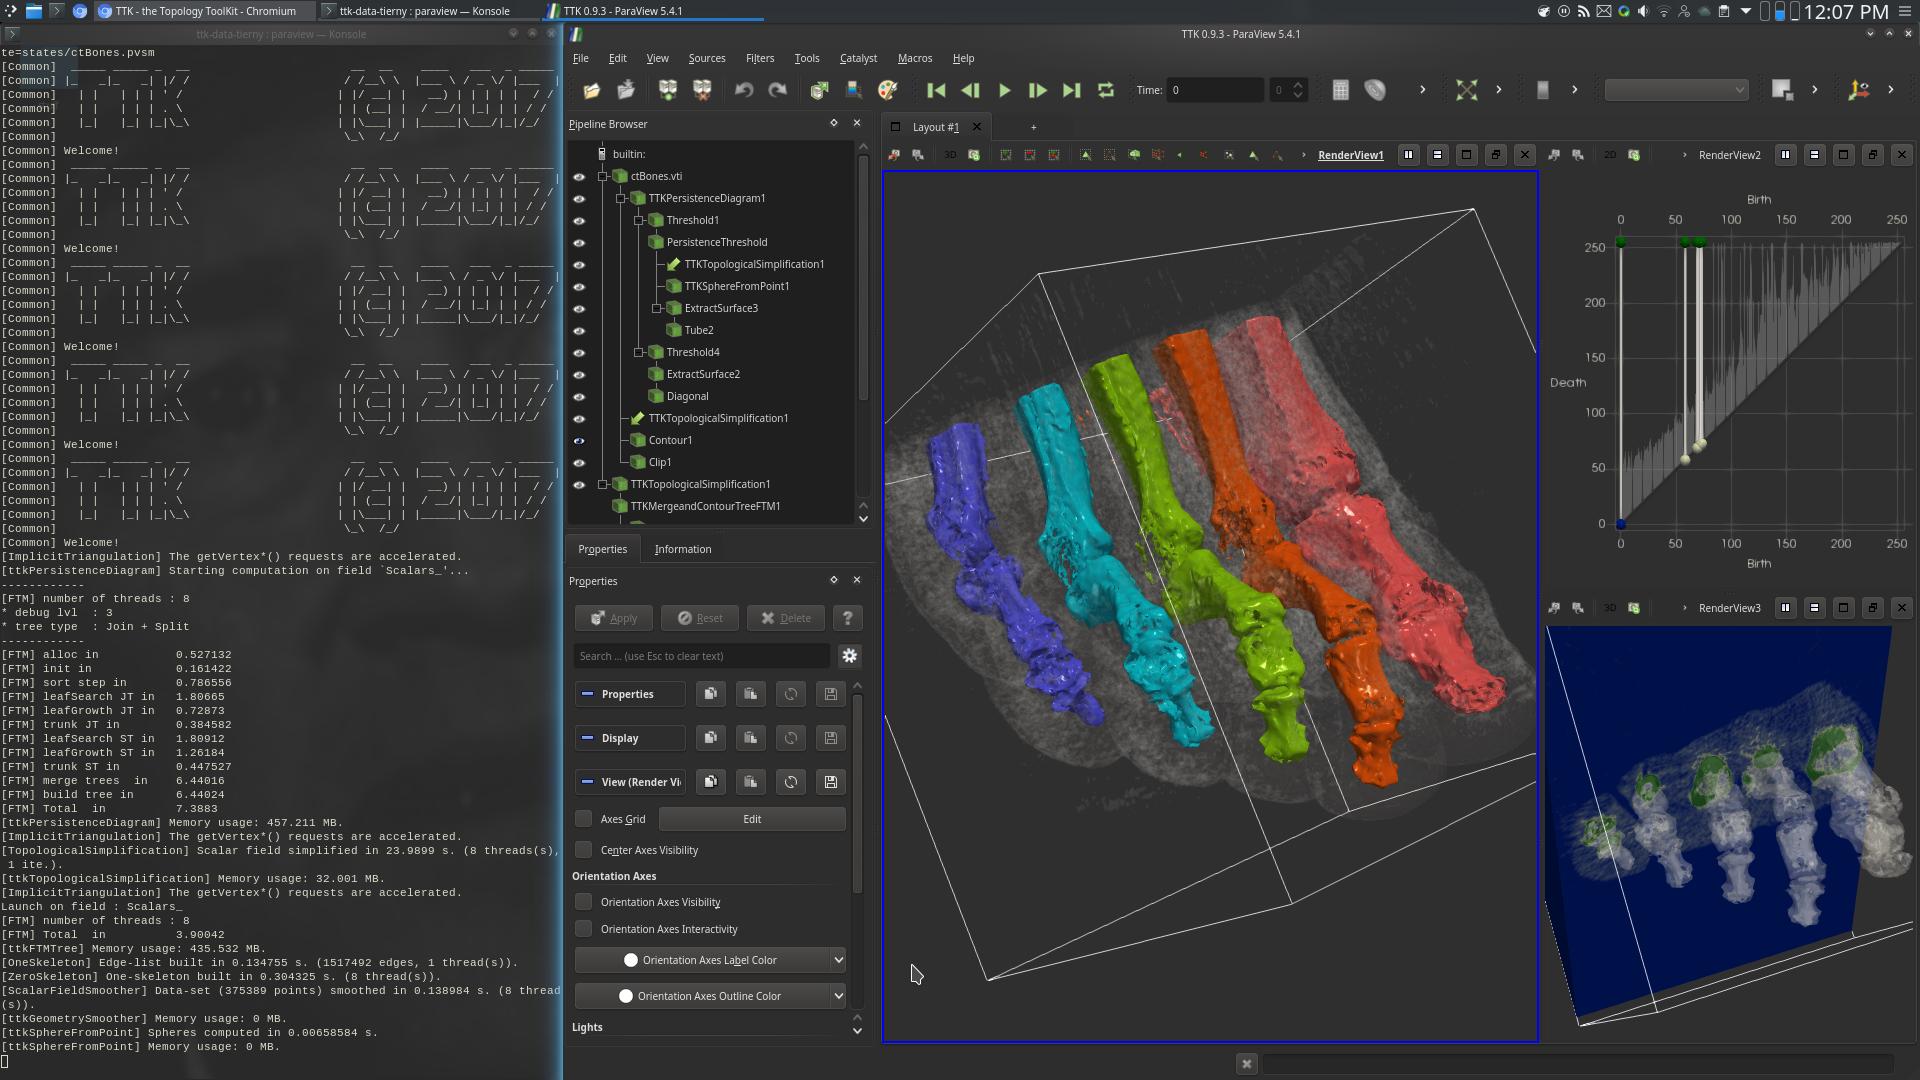
This example segments medical image data based on topological persistence.
First, the PersistenceDiagram of the data is computed (top right view, above screenshot).
Then, only the 5 most persistent maxima are selected, corresponding to the toes of the foot.
Next, the input data is simplified based on the selected persistent features, via TopologicalSimplification.
Next, the Split tree of the simplified data is computed.
Finally, the geometry of the bones of the toes is extracted by selecting the regions (in the 3D data) attached to the leaves (RegionType equals 1) of the Split tree (center view, above screenshot).
To get a refined segmentation, change the persistence threshold from 180 down to 150.
Each toe will be subdivided into two segments, precisely along the joints.
ParaView
To reproduce the above screenshot, go to your ttk-data directory and enter the following command:
paraview states/ctBones.pvsm
Python code
 1
 2
 3
 4
 5
 6
 7
 8
 9
10
11
12
13
14
15
16
17
18
19
20
21
22
23
24
25
26
27
28
29
30
31
32
33
34
35
36
37
38
39
40
41
42
43
44
45
46
47
48
49
50
51
52
53 | #!/usr/bin/env python
from paraview.simple import *
# create a new 'XML Image Data Reader'
ctBonesvti = XMLImageDataReader(FileName=["ctBones.vti"])
# create a new 'Calculator'
calculator1 = Calculator(Input=ctBonesvti)
calculator1.ResultArrayName = "Scalars_"
calculator1.Function = "-Scalars_"
# create a new 'TTK PersistenceDiagram'
tTKPersistenceDiagram1 = TTKPersistenceDiagram(Input=calculator1)
tTKPersistenceDiagram1.ScalarField = ["POINTS", "Scalars_"]
tTKPersistenceDiagram1.Dimensions = "Selected Dimensions (no infinite pairs)"
tTKPersistenceDiagram1.Saddlesaddlediagramdimension1slowest = False
# create a new 'Threshold'
threshold1 = Threshold(Input=tTKPersistenceDiagram1)
threshold1.Scalars = ["CELLS", "PairIdentifier"]
threshold1.ThresholdMethod = "Between"
threshold1.LowerThreshold = 0.0
threshold1.UpperThreshold = 999999999
# create a new 'Threshold'
persistenceThreshold = Threshold(Input=threshold1)
persistenceThreshold.Scalars = ["CELLS", "Persistence"]
persistenceThreshold.ThresholdMethod = "Between"
persistenceThreshold.LowerThreshold = 180.0
persistenceThreshold.UpperThreshold = 999999999
# create a new 'TTK TopologicalSimplification'
tTKTopologicalSimplification1 = TTKTopologicalSimplification(
Domain=calculator1, Constraints=persistenceThreshold
)
tTKTopologicalSimplification1.ScalarField = ["POINTS", "Scalars_"]
# create a new 'TTK Merge and Contour Tree ()'
tTKMergeandContourTree1 = TTKMergeTree(
Input=tTKTopologicalSimplification1
)
tTKMergeandContourTree1.ScalarField = ["POINTS", "Scalars_"]
tTKMergeandContourTree1.TreeType = "Join Tree"
# create a new 'Threshold'
threshold3 = Threshold(Input=OutputPort(tTKMergeandContourTree1, 2))
threshold3.Scalars = ["POINTS", "RegionType"]
threshold3.ThresholdMethod = "Between"
threshold3.LowerThreshold = 0.0
threshold3.UpperThreshold = 0.0
SaveData("CTBonesOutputSegmentation.vtu", threshold3)
|
To run the above Python script, go to your ttk-data directory and enter the following command:
pvpython python/ctBones.py
- ctBones.vti: a three-dimensional regular grid encoding material density in a medical image (CT scan).
Outputs
CTBonesOutputSegmentation.vtu: the geometry of the volume of the bones of the toes, as extracted by the analysis pipeline (most persistent super-level set connected components).
C++/Python API
MergeTree
PersistenceDiagram
TopologicalSimplification