Skip to content

Tracking Post-Processing

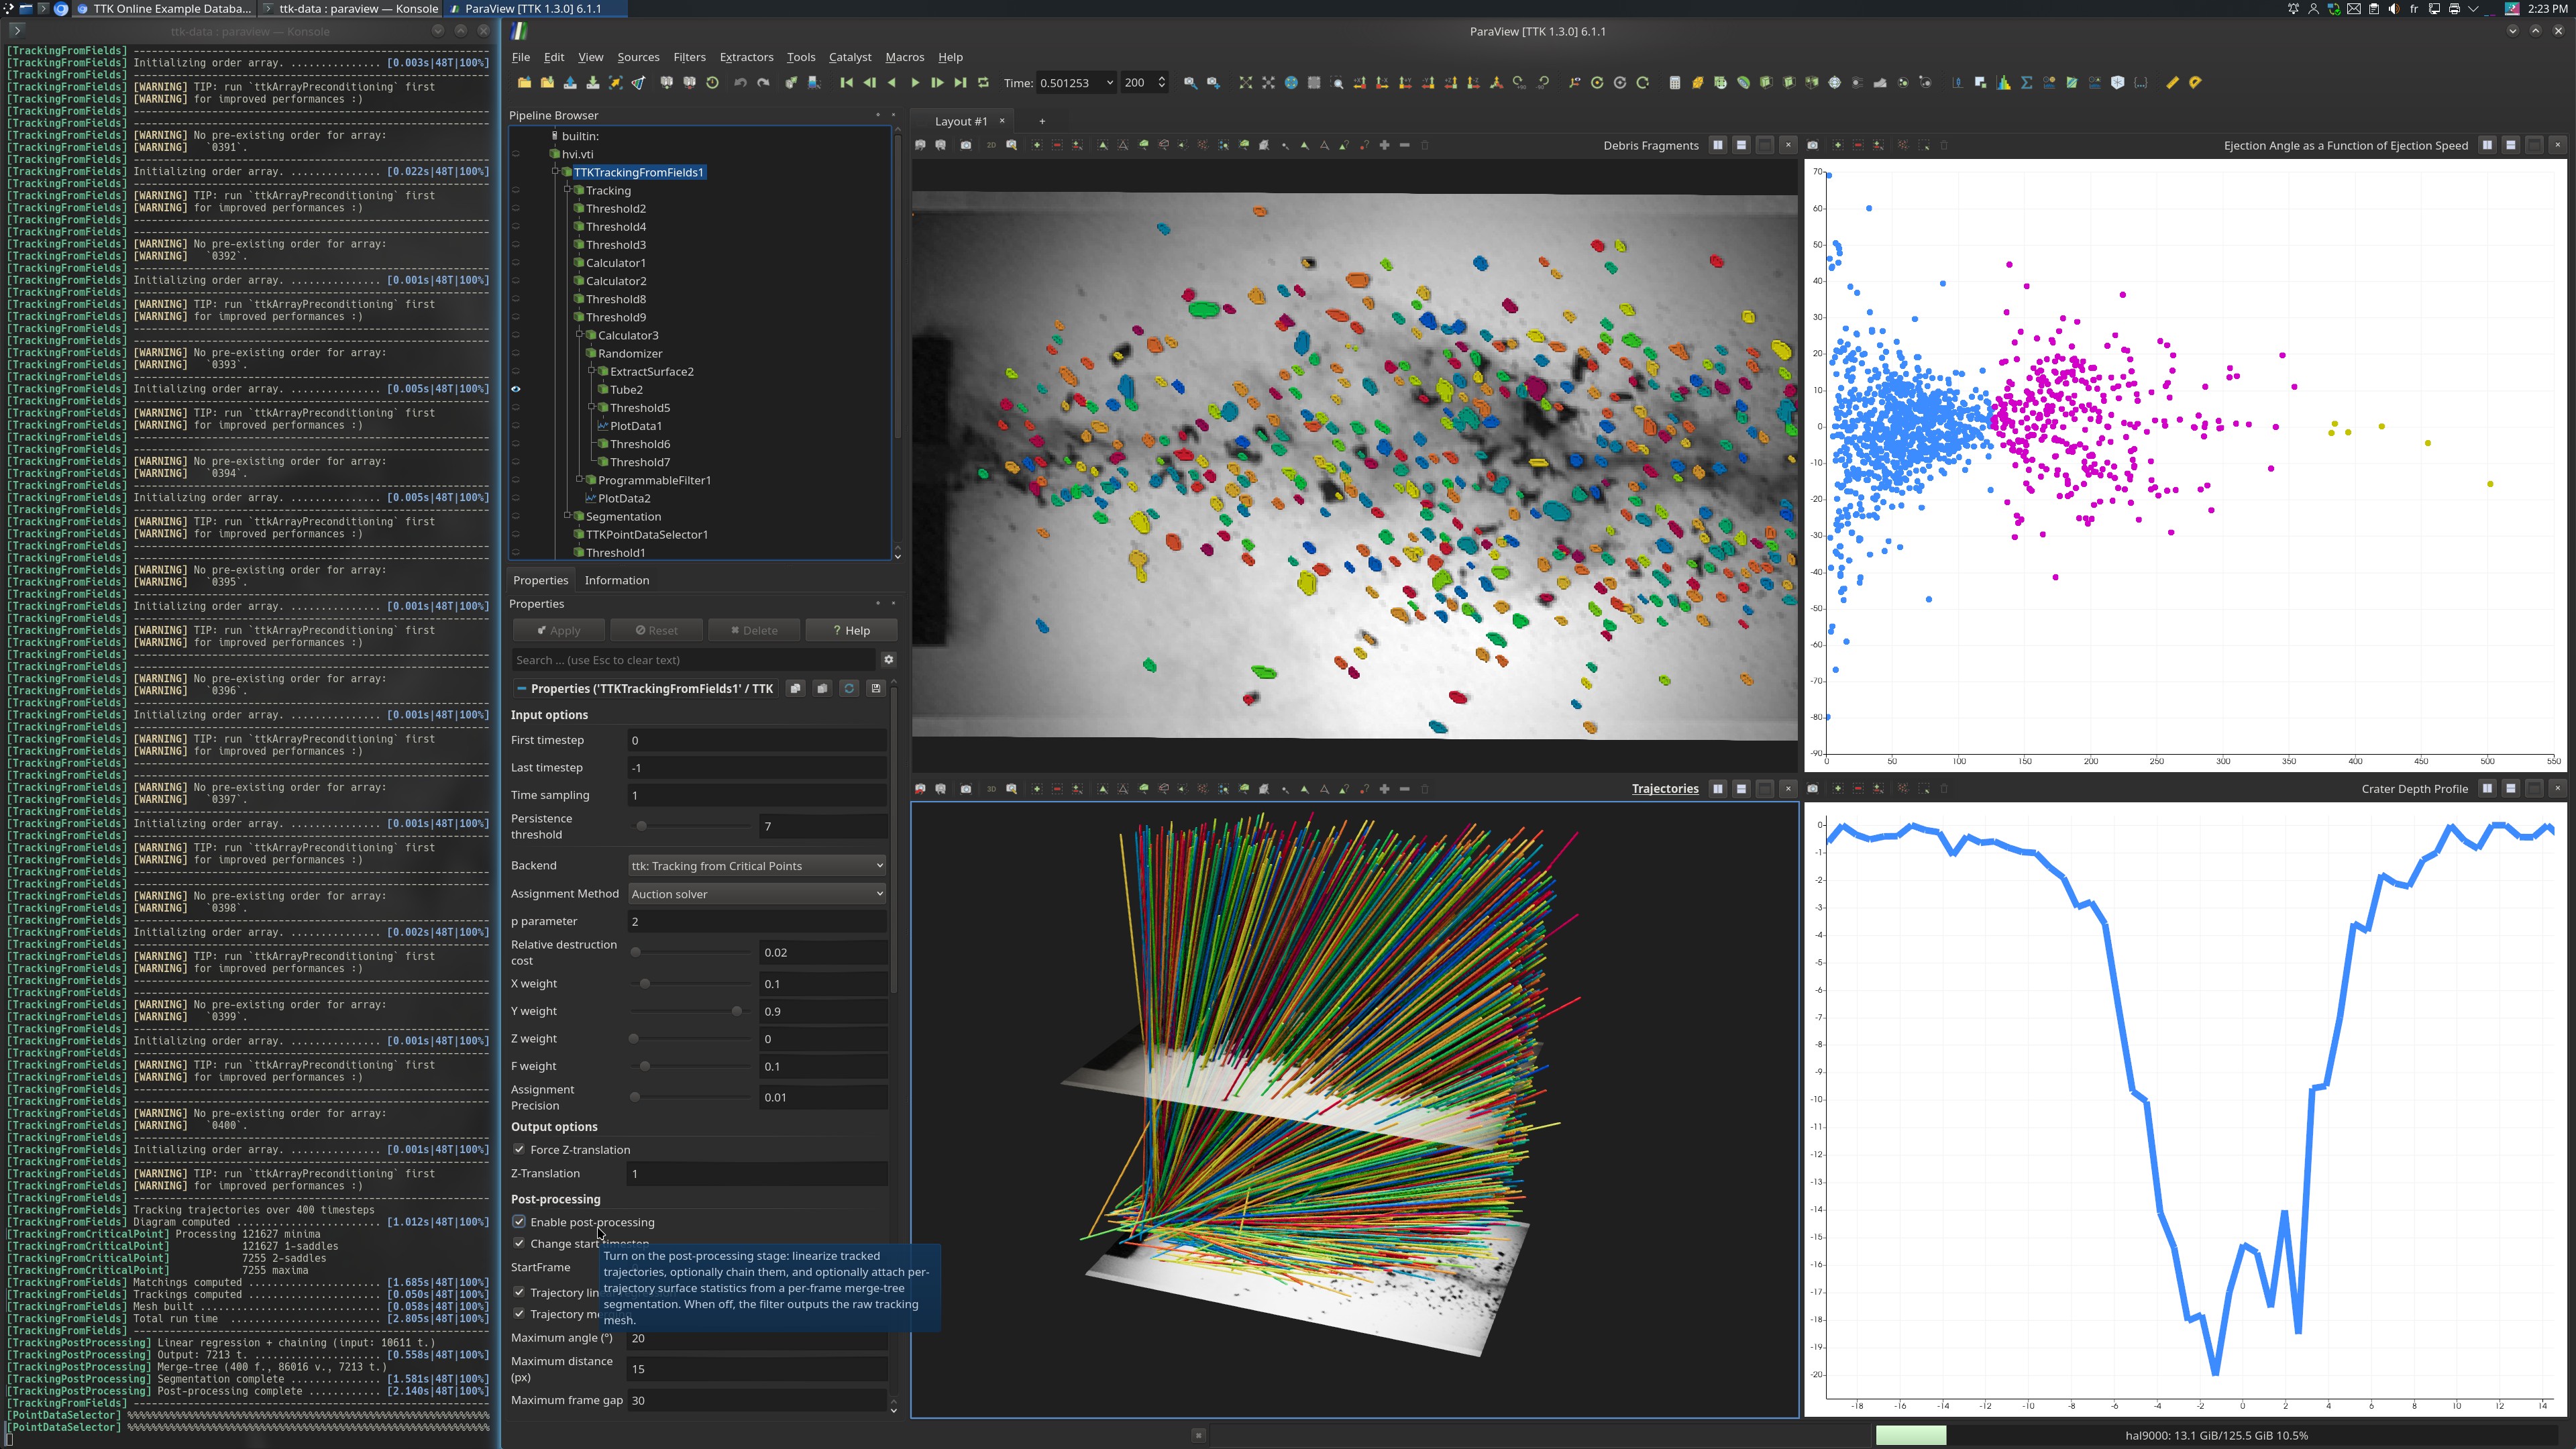
tracking post-processing screenshot

Pipeline description

This example loads a 2D time-varying scalar field, where time steps are stored as a sequence of data arrays, and tracks its extrema over time with TrackingFromFields. As in the Time Tracking and Tracking From Critical Points examples, each extremum is followed from one time step to the next by solving an optimal assignment problem between the persistence diagrams of consecutive steps, controlled by the persistence threshold and the relative destruction cost. Here, each tracked minimum captures an individual debris fragment ejected by a hypervelocity impact, so that the raw output of the tracking is, for every fragment, the sequence of its positions through the time-space domain.

This example focuses on the post-processing stage of the filter (parameter Enablepostprocessing), which turns these raw, frame-by-frame tracks into clean, analyzable trajectories and enriches them with geometric attributes. In particular, for each time step a merge-tree segmentation (parameter Computemergetreesegmentation) isolates the region around every tracked extremum and attaches to each trajectory the surface of its associated feature, recovering a measure of its size in addition to its position.

The resulting trajectory mesh carries, for each fragment, its linearized motion model (ax, bx, ay, by), its duration and its surface statistics. A sequence of Threshold filters then isolates the fragments of interest — by axial velocity (ax), duration (Duration), critical type (minima) and spatial region of origin (bx, by) — and two derived plots summarize the experiment: a crater profile, obtained by binning the impact positions (by), and an ejection diagram, plotting the ejection angle atan(ay / -ax) against the axial velocity -ax.

Beyond the two tracking parameters described in the other examples, the post-processing is mainly tuned through merging and segmentation controls: increase Maxlinkpx to allow longer reconnections between consecutive trajectory segments (decrease it to keep only tight, unambiguous links), and adjust Maxsurfacesize to bound the size of the segmented features (lower it to discard oversized background regions). Enabling Otsusimplification is recommended when the features sit on a noisy or slowly-varying background.

ParaView

To reproduce the above screenshot, go to your ttk-data directory and enter the following command:

paraview states/trackingPostProcessing.pvsm

Python code

  1
  2
  3
  4
  5
  6
  7
  8
  9
 10
 11
 12
 13
 14
 15
 16
 17
 18
 19
 20
 21
 22
 23
 24
 25
 26
 27
 28
 29
 30
 31
 32
 33
 34
 35
 36
 37
 38
 39
 40
 41
 42
 43
 44
 45
 46
 47
 48
 49
 50
 51
 52
 53
 54
 55
 56
 57
 58
 59
 60
 61
 62
 63
 64
 65
 66
 67
 68
 69
 70
 71
 72
 73
 74
 75
 76
 77
 78
 79
 80
 81
 82
 83
 84
 85
 86
 87
 88
 89
 90
 91
 92
 93
 94
 95
 96
 97
 98
 99
100
101
102
103
104
105
106
107
108
109
110
111
112
113
114
115
116
#!/usr/bin/env python
from paraview.simple import *
import numpy as np
from vtk.util import numpy_support as ns
from paraview import servermanager as sm

# physical constants
SCALE = 3.5      # pixels per mm
Y0 = 111.0       # crater origin (pixels)
DT = 5.68e-6     # seconds per frame
RHO = 1754.0     # kg/m^3

# custom processing functions
def export_crater_profile(source, filename="crater_profile.csv", bin_size=2):
    cd = sm.Fetch(source).GetCellData()
    by = ns.vtk_to_numpy(cd.GetArray("by"))
    seg = ns.vtk_to_numpy(cd.GetArray("SegmentationMean"))
    # mass per fragment: sphere of equivalent surface area (mg)
    r_mm = np.sqrt(seg / (SCALE * SCALE) / (4.0 * np.pi))
    mass_mg = RHO * (4.0 / 3.0) * np.pi * r_mm**3 * 1.0e-3
    start = np.floor(by.min() / bin_size) * bin_size
    end = np.ceil(by.max() / bin_size) * bin_size
    nbins = int(round((end - start) / bin_size))
    edges = start + np.arange(nbins + 1) * bin_size
    centers = start + (np.arange(nbins) + 0.5) * bin_size
    masses, _ = np.histogram(by, bins=edges, weights=mass_mg)
    x_mm = -((centers - Y0) / SCALE)
    np.savetxt(
        filename,
        np.column_stack([x_mm, -masses]),
        delimiter=",",
        header="X_mm,Mass_neg_mg",
        comments="",
        fmt="%.6g",
    )

def export_ejection_angle(source, filename="ejection_angle.csv"):
    cd = sm.Fetch(source).GetCellData()
    ax = ns.vtk_to_numpy(cd.GetArray("ax"))
    ay = ns.vtk_to_numpy(cd.GetArray("ay"))
    axial = -ax * 1.0e-3 / SCALE / DT  # px/frame -> m/s
    angle = np.degrees(np.arctan(ay / -ax))
    np.savetxt(
        filename,
        np.column_stack([axial, angle]),
        delimiter=",",
        header="axial_velocity_ms,ejection_angle",
        comments="",
        fmt="%.6g",
    )

# main pipeline

# create a new 'XML Image Data Reader'
impactvti = XMLImageDataReader(FileName=["hvi.vti"])

# create a new 'TTK TrackingFromFields'
tTKTrackingFromFields1 = TTKTrackingFromFields(Input=impactvti)
tTKTrackingFromFields1.Set(
    Persistencethreshold=7.0,
    Relativedestructioncost=0.02,
    Xweight=0.1,
    Yweight=0.9,
    Zweight=0.0,
    Fweight=0.1,
    ForceZtranslation=1,
    Enablepostprocessing=1,
    ChangeStartFrame=1,
    Maxlinkpx=15.0,
    Computemergetreesegmentation=1,
    Maxsurfacesize=100,
    Otsusimplification=1,
)

# create a new 'Threshold'
axial_velocity = Threshold(Input=tTKTrackingFromFields1)
axial_velocity.Set(
    Scalars=["CELLS", "ax"],
    LowerThreshold=-27.0,
    UpperThreshold=-0.001,
)

# create a new 'Threshold'
duration = Threshold(Input=axial_velocity)
duration.Set(
    Scalars=["CELLS", "Duration"],
    LowerThreshold=10.0,
    UpperThreshold=442.0,
)

# create a new 'Threshold'
minima = Threshold(Input=duration)
minima.Scalars = ["CELLS", "CriticalType"]
minima.LowerThreshold = 0.0
minima.UpperThreshold = 0.0

# create a new 'Threshold'
xBoxOrigin = Threshold(Input=minima)
xBoxOrigin.Set(
    Scalars=["CELLS", "bx"],
    LowerThreshold=250.0,
    UpperThreshold=420.0,
)

# create a new 'Threshold'
yBoxOrigin = Threshold(Input=xBoxOrigin)
yBoxOrigin.Set(
    Scalars=["CELLS", "by"],
    LowerThreshold=60.0,
    UpperThreshold=180.0,
)

export_crater_profile(yBoxOrigin)
export_ejection_angle(yBoxOrigin)

SaveData("debrisTrajectories.vtu", yBoxOrigin)

To run the above Python script, go to your ttk-data directory and enter the following command:

pvpython python/trackingPostProcessing.py

Inputs

  • hvi.vti: 2D time-varying scalar field capturing debris fragments ejected by a hypervelocity impact, with each time step stored as a separate data array.

Outputs

  • debrisTrajectories.vtu: space-time trajectories of the selected debris fragments.
  • crater_profile.csv: debris mass (mg) binned by centered vertical impact position (mm).
  • ejection_angle.csv: ejection angle (°) versus axial velocity (m/s) per fragment.

C++/Python API

TrackingFromFields